GBP/JPY Price Forecast: British Pound faces a cluster of resistance near 213



- GBP/JPY struggles to extend its gains as buyers face a cluster of resistance.
- The 61.8% Fibonacci retracement and the 100-day and 200-day SMAs form a resistance zone between 212.90 and 213.03.
- RSI and MACD point to mildly bullish momentum, while ADX near 17 signals a weak trend.
GBP/JPY trades with a modest bullish bias on Tuesday but struggles to build on the previous day’s 0.32% gain. At the time of writing, the cross trades around 212.44, up 0.09% on the day, with the 100-day and 200-day Simple Moving Averages (SMAs) near 213.00 capping the immediate upside.
Technical Analysis
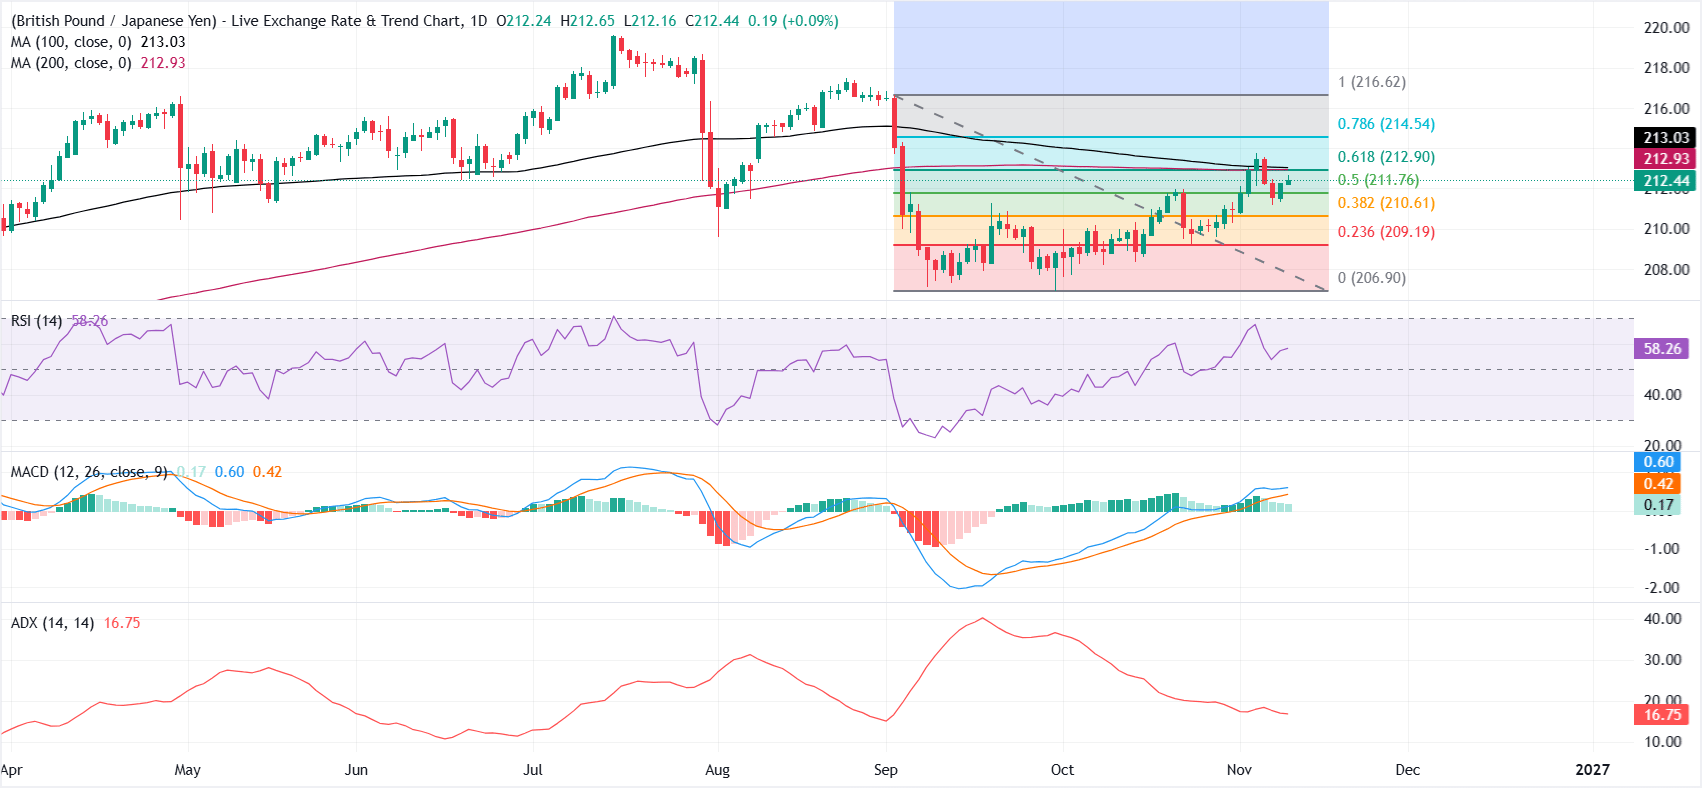
On the daily chart, the pair also sits just under the 61.8% Fibonacci retracement at 212.90, underscoring a dense band of overhead supply despite a constructive tone in momentum, with the Relative Strength Index (RSI) hovering near 58 and the Moving Average Convergence Divergence (MACD) line staying in positive territory, even as the Average Directional Index (ADX) near 17 hints at a weakening trend.
A break above the 61.8% Fibonacci retracement at 212.90, the 200-day SMA at 212.93 and the 100-day SMA at 213.03 would open the door to the 78.6% retracement at 214.54, followed by the recent high near 216.62.
On the downside, initial support sits at the 50% Fibonacci retracement near 211.76. A break below that level would bring the 38.2% retracement at 210.61 into focus, followed by the 23.6% level at 209.19 and the swing low near 206.90.
(The technical analysis of this story was written with the help of an AI tool. Know more.)
Japanese Yen Price Today
The table below shows the percentage change of Japanese Yen (JPY) against listed major currencies today. Japanese Yen was the strongest against the Australian Dollar.
| USD | EUR | GBP | JPY | CAD | AUD | NZD | CHF | |
|---|---|---|---|---|---|---|---|---|
| USD | 0.06% | 0.11% | 0.21% | 0.10% | 0.32% | 0.07% | 0.15% | |
| EUR | -0.06% | 0.05% | 0.14% | 0.06% | 0.25% | 0.02% | 0.09% | |
| GBP | -0.11% | -0.05% | 0.08% | 0.00% | 0.20% | -0.05% | 0.04% | |
| JPY | -0.21% | -0.14% | -0.08% | -0.09% | 0.12% | -0.13% | -0.06% | |
| CAD | -0.10% | -0.06% | -0.00% | 0.09% | 0.21% | -0.04% | 0.04% | |
| AUD | -0.32% | -0.25% | -0.20% | -0.12% | -0.21% | -0.25% | -0.17% | |
| NZD | -0.07% | -0.02% | 0.05% | 0.13% | 0.04% | 0.25% | 0.08% | |
| CHF | -0.15% | -0.09% | -0.04% | 0.06% | -0.04% | 0.17% | -0.08% |
The heat map shows percentage changes of major currencies against each other. The base currency is picked from the left column, while the quote currency is picked from the top row. For example, if you pick the Japanese Yen from the left column and move along the horizontal line to the US Dollar, the percentage change displayed in the box will represent JPY (base)/USD (quote).