

Bitcoin Price Forecast: BTC stalls near $67,300 resistance as downside risks linger

- Bitcoin price faces resistance near $67,300 on Thursday, indicating potential downside risk.
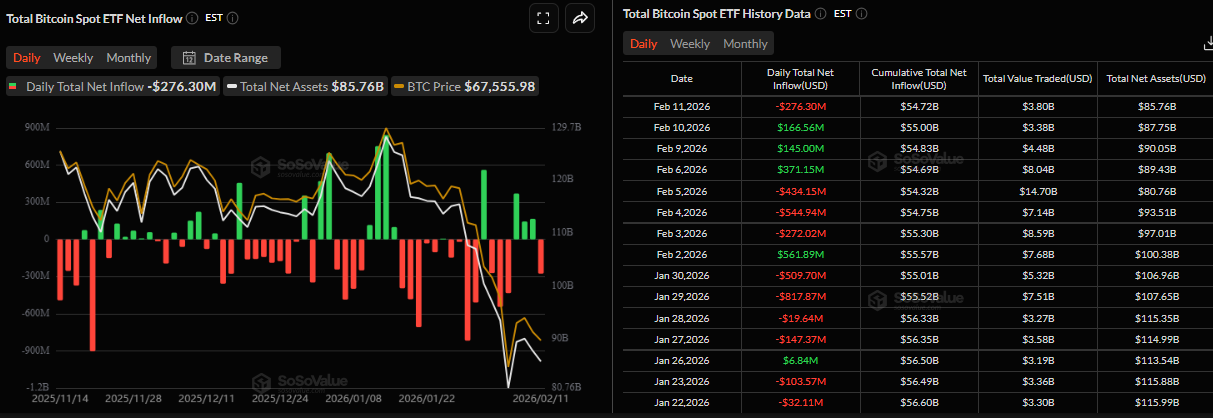
- US-listed spot ETFs recorded an outflow of $276.30 million on Wednesday, breaking three consecutive days of inflows.
- On-chain data show rare volume signal, which suggests possible consolidation or a retest of recent lows before a sustained rebound.
Bitcoin (BTC) price is steadying at $67,000 on Thursday and faces resistance near the previously broken lower consolidation boundary at $67,300, signaling potential downside risk ahead. Institutional demand recorded an outflow of over $276 million on Wednesday, breaking three consecutive days of inflows and signaling indecision among investors. Meanwhile, on-chain data highlights a rare volume signal historically associated with local price extremes, suggesting possible consolidation or a retest of recent lows before a sustained rebound.
Indecision among institutional investors
Institutional demand shows mixed sentiment among investors so far this week. SoSoValue data show that spot Bitcoin Exchange Traded Funds (ETFs) recorded an outflow of $276.30 million on Wednesday, following three consecutive days of net positive flows since last Friday. This mixed flow pattern signals investor indecision and could keep Bitcoin trading sideways in the near term.
Why BTC could consolidate or retest recent lows before a sustained rebound?
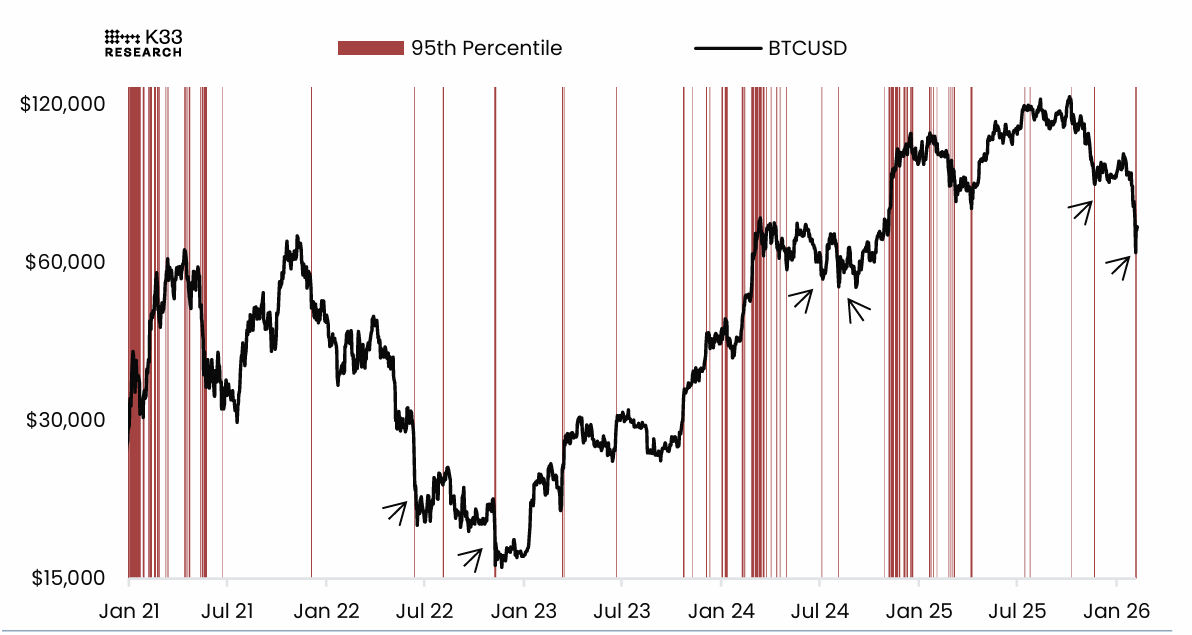
A K33 report explains that the volume spikes occur during local extremes. BTCUSD performance overlayed with 95th percentile trading volume days compared to a rolling 365-day window, as shown in the chart below.
The analyst explained that the two phenomena are clear from the chart: During strong bull markets, volumes push outlier readings relative to the past 365-day volume average, whereas during drawdowns, outlier readings typically occur at local bottoms or peaks.
On February 5 and 6, BTC recorded consecutive 95th-percentile volume days. Historically, this has occurred only once in a bear market: on November 9, 2022, after the collapse of the FTX exchange. This highlights heightened fears and a substantial appetite to bid BTC at $60,000-$69,000 (sideways market). However, history shows that such volume spikes do not guarantee an immediate bottom. Prices often consolidate or retest nearby lows before a sustainable recovery begins.
Bitcoin Price Forecast: BTC could revist $60,000 mark
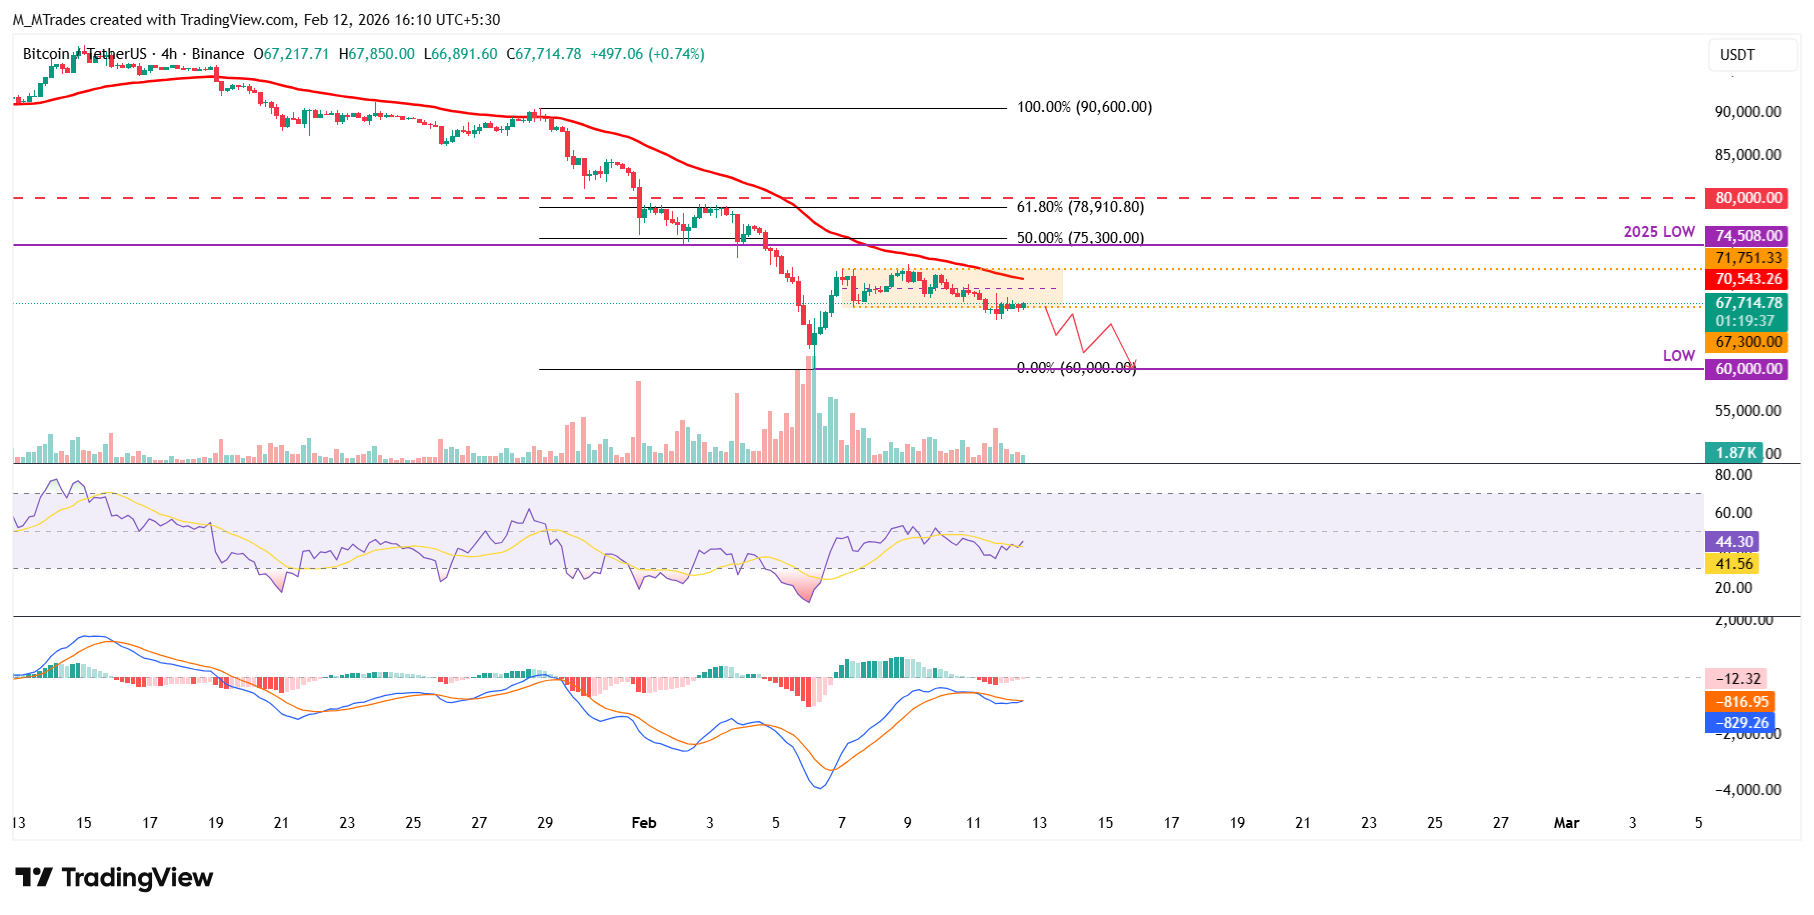
The Bitcoin price on the 4-hour chart shows that the Crypto King has been trading sideways between $67,300 and $71,751 after recovering from a low of $60,000 on Friday. On Wednesday, BTC slipped below the lower boundary of this consolidation. At the time of writing, BTC is revisiting this broken level.
If BTC faces rejection from the lower consolidation boundary at $67,300, it could extend the correction to revisit Friday’s low at $60,000.
The Relative Strength Index (RSI) on the 4-hour chart reads 44, below the neutral level of 50, indicating bearish momentum gaining traction. However, the Moving Average Convergence Divergence (MACD) lines are converging, increasing the likelihood of a bullish crossover. If the MACD fails to confirm the mentioned crossover, this would suggest bearish momentum remains intact, increasing the risk of a further correction.
On the daily chart, Bitcoin faced rejection near the daily resistance at $73,072 on Sunday and has declined nearly 5% through Wednesday, nearing the 78.6% Fibonacci retracement (drawn from the August 2024 low of $49,000 to the October 2025 all-time high of $126,199) at $65,520. At the time of writing on Thursday, BTC is trading at $67,600.
If BTC continues its downward trend and closes below $65,520, it could extend the decline toward Friday’s low of $60,000.
The Relative Strength Index (RSI) on the daily chart is at 31, pointing downward toward the oversold territory, suggesting bearish momentum is gaining traction. In addition, the Moving Average Convergence Divergence (MACD) in the same period shows a bearish crossover, suggesting a continuation of the downward trend.
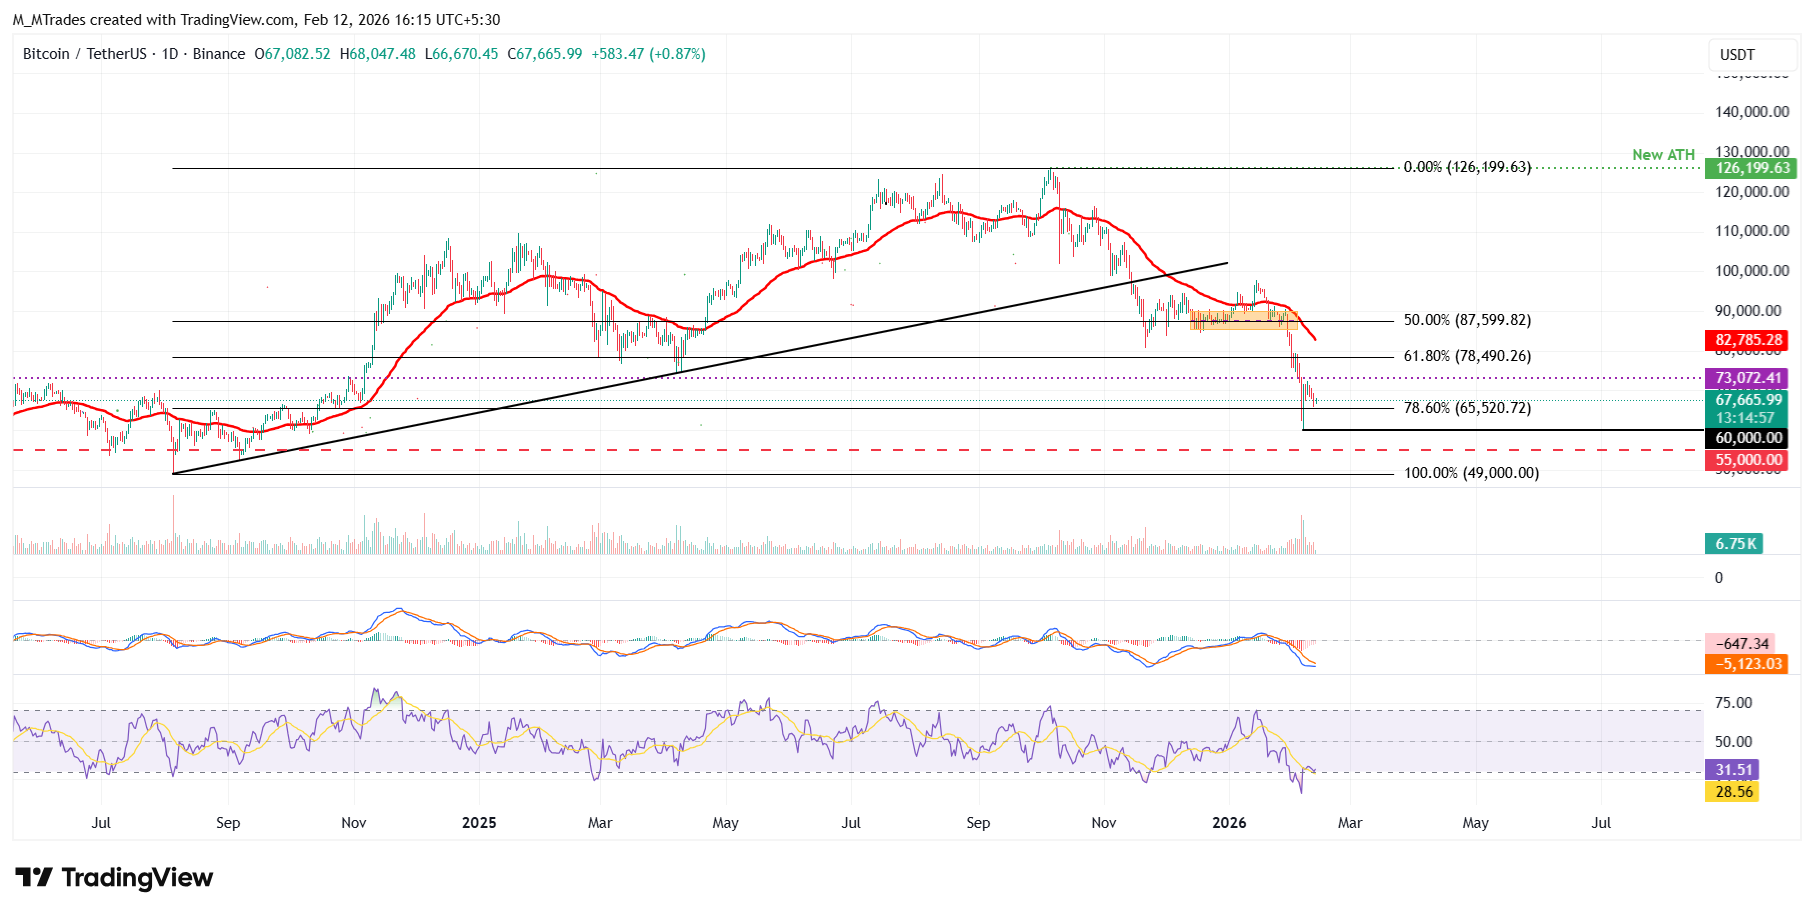
On the contrary, if BTC recovers, it could extend the advance toward the daily resistance at $73,072.
Bitcoin, altcoins, stablecoins FAQs
Bitcoin is the largest cryptocurrency by market capitalization, a virtual currency designed to serve as money. This form of payment cannot be controlled by any one person, group, or entity, which eliminates the need for third-party participation during financial transactions.
Altcoins are any cryptocurrency apart from Bitcoin, but some also regard Ethereum as a non-altcoin because it is from these two cryptocurrencies that forking happens. If this is true, then Litecoin is the first altcoin, forked from the Bitcoin protocol and, therefore, an “improved” version of it.
Stablecoins are cryptocurrencies designed to have a stable price, with their value backed by a reserve of the asset it represents. To achieve this, the value of any one stablecoin is pegged to a commodity or financial instrument, such as the US Dollar (USD), with its supply regulated by an algorithm or demand. The main goal of stablecoins is to provide an on/off-ramp for investors willing to trade and invest in cryptocurrencies. Stablecoins also allow investors to store value since cryptocurrencies, in general, are subject to volatility.
Bitcoin dominance is the ratio of Bitcoin's market capitalization to the total market capitalization of all cryptocurrencies combined. It provides a clear picture of Bitcoin’s interest among investors. A high BTC dominance typically happens before and during a bull run, in which investors resort to investing in relatively stable and high market capitalization cryptocurrency like Bitcoin. A drop in BTC dominance usually means that investors are moving their capital and/or profits to altcoins in a quest for higher returns, which usually triggers an explosion of altcoin rallies.
Recommended Articles


Comments (0)
Click the $ button, enter the symbol, and select to link a stock, ETF, or other ticker.