

This Recession-Forecasting Algorithm Hasn't Been Wrong in 65 Years -- and It Has an Ominous Message for Wall Street

Key Points
This has been a roller coaster year for the S&P 500, Nasdaq Composite, and Dow Jones Industrial Average, with all three enduring a mini-crash and a rip-roaring rally to new highs.
A new machine-learning algorithm from Moody's Analytics offers a potentially dire outlook for the U.S. economy and stocks.
On the other hand, historical precedent tends to favor optimists and long-term investors.
Wall Street's three major stock indexes have been on quite the roller coaster since 2025 began.
Shortly after President Donald Trump unveiled his tariff and trade policy following the close of trading on April 2, the broad-based S&P 500 (SNPINDEX: ^GSPC), growth-dependent Nasdaq Composite (NASDAQINDEX: ^IXIC), and iconic Dow Jones Industrial Average (DJINDICES: ^DJI) all endured a mini-crash. The S&P 500 and Dow entered correction territory, with the Nasdaq falling into its first bear market since 2022. The S&P 500 also endured its fifth-steepest two-day percentage drop in 75 years.
Where to invest $1,000 right now? Our analyst team just revealed what they believe are the 10 best stocks to buy right now. Continue »
Then the script completely flipped on April 9, when Trump announced a 90-day pause on "reciprocal tariffs" for dozens of countries. The S&P 500, Dow, and Nasdaq Composite logged their largest single-session point gains in their respective histories and have all since blasted to multiple record-closing highs.
It would appear that everything is going perfectly for the stock market and U.S. economy -- but looks can be deceiving.

Image source: Getty Images.
This predictive algorithm has a flawless track record of forecasting U.S. recessions
At any given moment, there's always a metric or historical event that's a threat to drag Wall Street's major stock indexes lower. For example, the S&P 500's Shiller Price-to-Earnings (P/E) Ratio is knocking on the door of its second-priciest valuation when back-tested more than 150 years. Throughout history, extended stock valuations of this magnitude have been a harbinger of disaster.
But an even more nefarious predictive tool, courtesy of Moody's (NYSE: MCO) Analytics, portends trouble for the U.S. economy and stock market.
In mid-July, Moody's Analytics released its findings from a newly developed model that relies on machine learning (ML) to estimate the probability of a U.S. recession within the next 12 months. Its model leans on a laundry list of economic inputs and back-tested findings from 1960 to 2025 to come up with historic recession probabilities.
When back-tested to 1960, any recession probability near or above 50% has eventually (keyword!) been followed by a recession. Moody's ML model identified eight such instances from 1960 to 2020 when the recession probability surpassed 50%, and a U.S. recession followed every time.
There is an uncomfortably high 48% probability that the U.S. economy will suffer a recession in the next 12 months. That's according to Moody's recently unveiled leading economic indicator, derived using a machine learning algorithm on our extensive databases. It's less than 50%,... pic.twitter.com/AGuEJznDzQ
-- Mark Zandi (@Markzandi) September 14, 2025
As you'll note in the post above on social media platform X (formerly Twitter) from Mark Zandi, chief economist at Moody's Analytics, his company's ML-driven model is currently projecting a 48% chance of a U.S. recession over the next year. Though it's not quite at the 50% threshold that has guaranteed a recession over the last 65 years, any figure well above 40% has also been a surefire indicator of an economic downturn.
In particular, Zandi pointed to the model homing in on building permits as a key predictor of the U.S. economy shifting into reverse: "The algorithm has identified building permits as the most critical economic variable for predicting recessions. And while permits had been holding up reasonably well, as builders supported sales through interest rate buydowns and other incentives, inventories of unsold homes are now high and on the rise."
Residential building permits have tapered to their lowest level since the height of the pandemic.
Although the S&P 500, Dow Jones Industrial Average, and Nasdaq Composite aren't tied at the hip to the U.S. economy, a recession would be expected to negatively impact corporate earnings. With the S&P 500's Shiller P/E already pushing to quite the premium, it probably wouldn't take much to tip the stock market into a correction, or perhaps an even steeper decline.

Image source: Getty Images.
Wall Street's newest algorithm has nothing on historical precedent
While the above forecast isn't exactly encouraging, especially considering the flawless track record of Moody's newly minted ML model over a 65-year period, it doesn't hold a candle to historical precedent that extends well beyond 1960.
Let's address the obvious: Recessions are normal, healthy, and inevitable events. No amount of well-wishing or monetary policy maneuvering can prevent these downturns from taking shape every now and then.
Even if Moody's Analytics' model isn't spot on about a recession taking shape over the next 12 months, there's a good probability of one ensuing sooner than later.
But the other side to this coin is equally important. Namely, recessions are typically short-lived. Since the end of World War II, the average recession has lasted just 10 months, with none surpassing 18 months.
In comparison, the typical economic expansion over the last 80 years has clocked in at five years, with two periods of growth surpassing the 10-year mark. These disproportionately long periods of growth are what allow the U.S. economy and corporate earnings to grow over long periods.
This nonlinearity observed in the U.S. economy translates to the stock market as well.
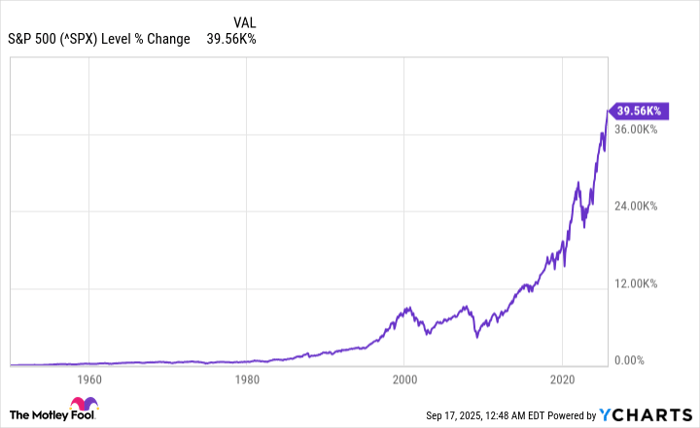
^SPX data by YCharts. S&P 500 return from Jan. 3, 1950-Sept. 16, 2025.
Data published on X by the Bespoke Investment Group in June 2023 showed a sizable difference between the calendar-day length of S&P 500 bull and bear markets. Dating back to the start of the Great Depression in September 1929, the average bear market has lasted just 286 calendar days (less than 10 months), while the typical bull market endured for 1,011 calendar days (roughly two years and nine months).
Panning out even further produces a similar story.
The analysts at Crestmont Research calculated the rolling 20-year total returns, including dividends, of the S&P 500 dating back to 1900. Though the S&P didn't officially exist until 1923, researchers were able to track the performance of its components in other major indexes back to 1900 to obtain total return data.
According to Crestmont's findings, all 106 rolling 20-year periods produced positive annualized total returns. This is to say that if investors had, hypothetically, purchased an S&P 500-tracking index at any point from 1900 to 2005 and simply held that position for 20 years, they would have made money. Regardless of whether they held through a recession or depression, a pandemic, a war, or countless other scares, the stock market has remained resilient, with the S&P 500 higher, on a total return basis, for every 20-year period since 1900.
Even if Moody's newest ML model proves accurate, it's no cause for long-term investors to panic.
Should you invest $1,000 in S&P 500 Index right now?
Before you buy stock in S&P 500 Index, consider this:
The Motley Fool Stock Advisor analyst team just identified what they believe are the 10 best stocks for investors to buy now… and S&P 500 Index wasn’t one of them. The 10 stocks that made the cut could produce monster returns in the coming years.
Consider when Netflix made this list on December 17, 2004... if you invested $1,000 at the time of our recommendation, you’d have $651,345!* Or when Nvidia made this list on April 15, 2005... if you invested $1,000 at the time of our recommendation, you’d have $1,080,327!*
Now, it’s worth noting Stock Advisor’s total average return is 1,058% — a market-crushing outperformance compared to 189% for the S&P 500. Don’t miss out on the latest top 10 list, available when you join Stock Advisor.
*Stock Advisor returns as of September 15, 2025
Sean Williams has no position in any of the stocks mentioned. The Motley Fool has positions in and recommends Moody's. The Motley Fool has a disclosure policy.
Related Articles
National Debt Bomb Ignited? Musk Warns U.S. Will Be 1000% Bankrupt Without AI
TradingKey - Tesla (TSLA) CEO Elon Musk recently issued another warning regarding the rapidly ballooning U.S. national debt. He stated clearly that without artificial intelligence and robotics, the United States will inevitably head toward fiscal bankruptcy.
Tesla Stock Outlook: Competing With Rivian, Robotaxi Potential, and 2026 Prospects
There is much conversation about the prospect of investing in Tesla (TSLA) as we move closer to 2026. The volatility of its share price in 2025 is leading many investors to consider if they should purchase shares of Tesla given the alternatives available in terms of electric vehicles (Rivian, etc.).
A Crash After a Surge: Why Silver Lost 40% in a Week?
TradingKey - Spot silver (XAGUSD) prices continue to decline. Silver plunged 20% on Thursday, breaking below $71 per ounce, with the sell-off intensifying on Friday as prices fell further below $64. Compared to the all-time high set on January 29, silver prices have retraced more than 40%, wiping out nearly all gains accumulated over the previous month.
Is Bitcoin’s Four-Year Cycle Dead in 2026?
Is the Bitcoin 4-year cycle dead? After 2025 broke historical records with a red post-halving year, institutional analysts explore if the Bitcoin price has decoupled from the halving countdown. Analyze the impact of spot ETFs, global liquidity, and the roadmap to the 2028 halving in this 2026 market

