

Jupiter Price Forecast: Bullish momentum holds on increasing revenues, DEX volumes

- Jupiter extends its rally above the 50-day EMA, teasing a breakout from a crucial resistance level.
- On-chain data shows steady revenue collection and rising DEX volumes, suggesting consistent demand.
- Fresh capital inflows into JUP futures Open Interest and a spike in short liquidations support the bullish bias.
Jupiter (JUP) extends its recovery with 7% gains at press time on Wednesday, building on the 8% gains from Tuesday. The Solana-based Decentralized Exchange (DEX) rallies on Coinbase integration amid steady network demand, as reflected in weekly revenue and volumes. Renewed retail interest in Jupiter fuels its futures Open Interest amid increasing short liquidations, highlighting an upside bias.
User demand spike improves Jupiter network health
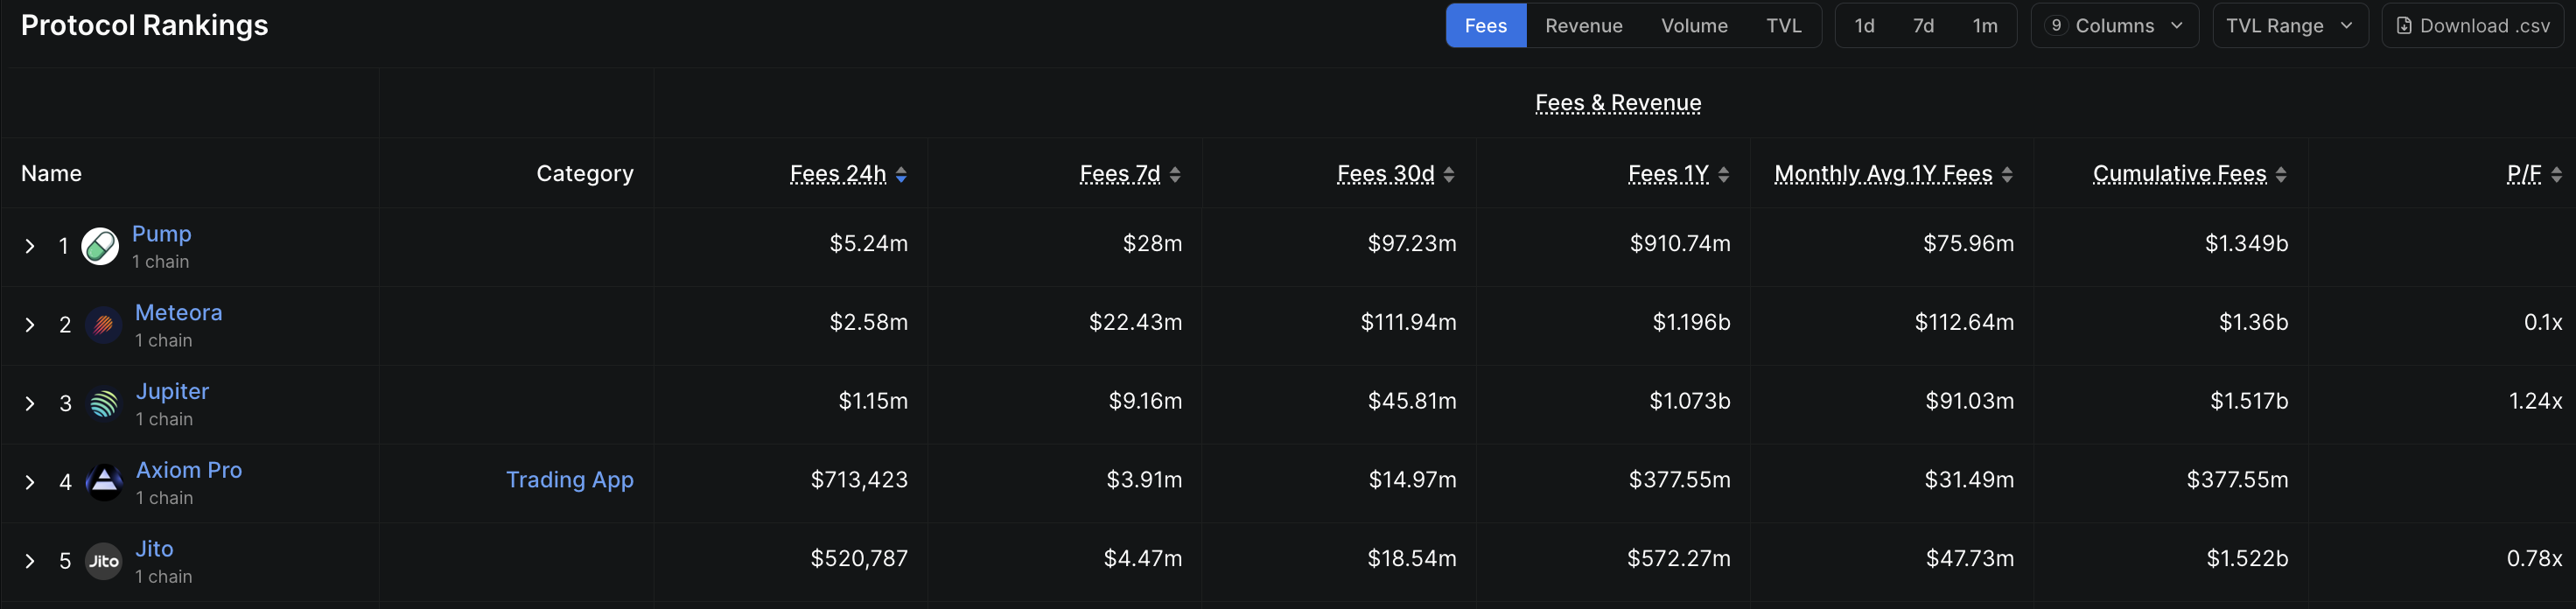
Jupiter ranks among the top three Solana-based protocols, collecting $1.15 million in fees over the last 24 hours. The increased short-term demand for Jupiter aligns with the Coinbase integration announced on Friday and brings in volumes from the US (except New York) and Brazil.
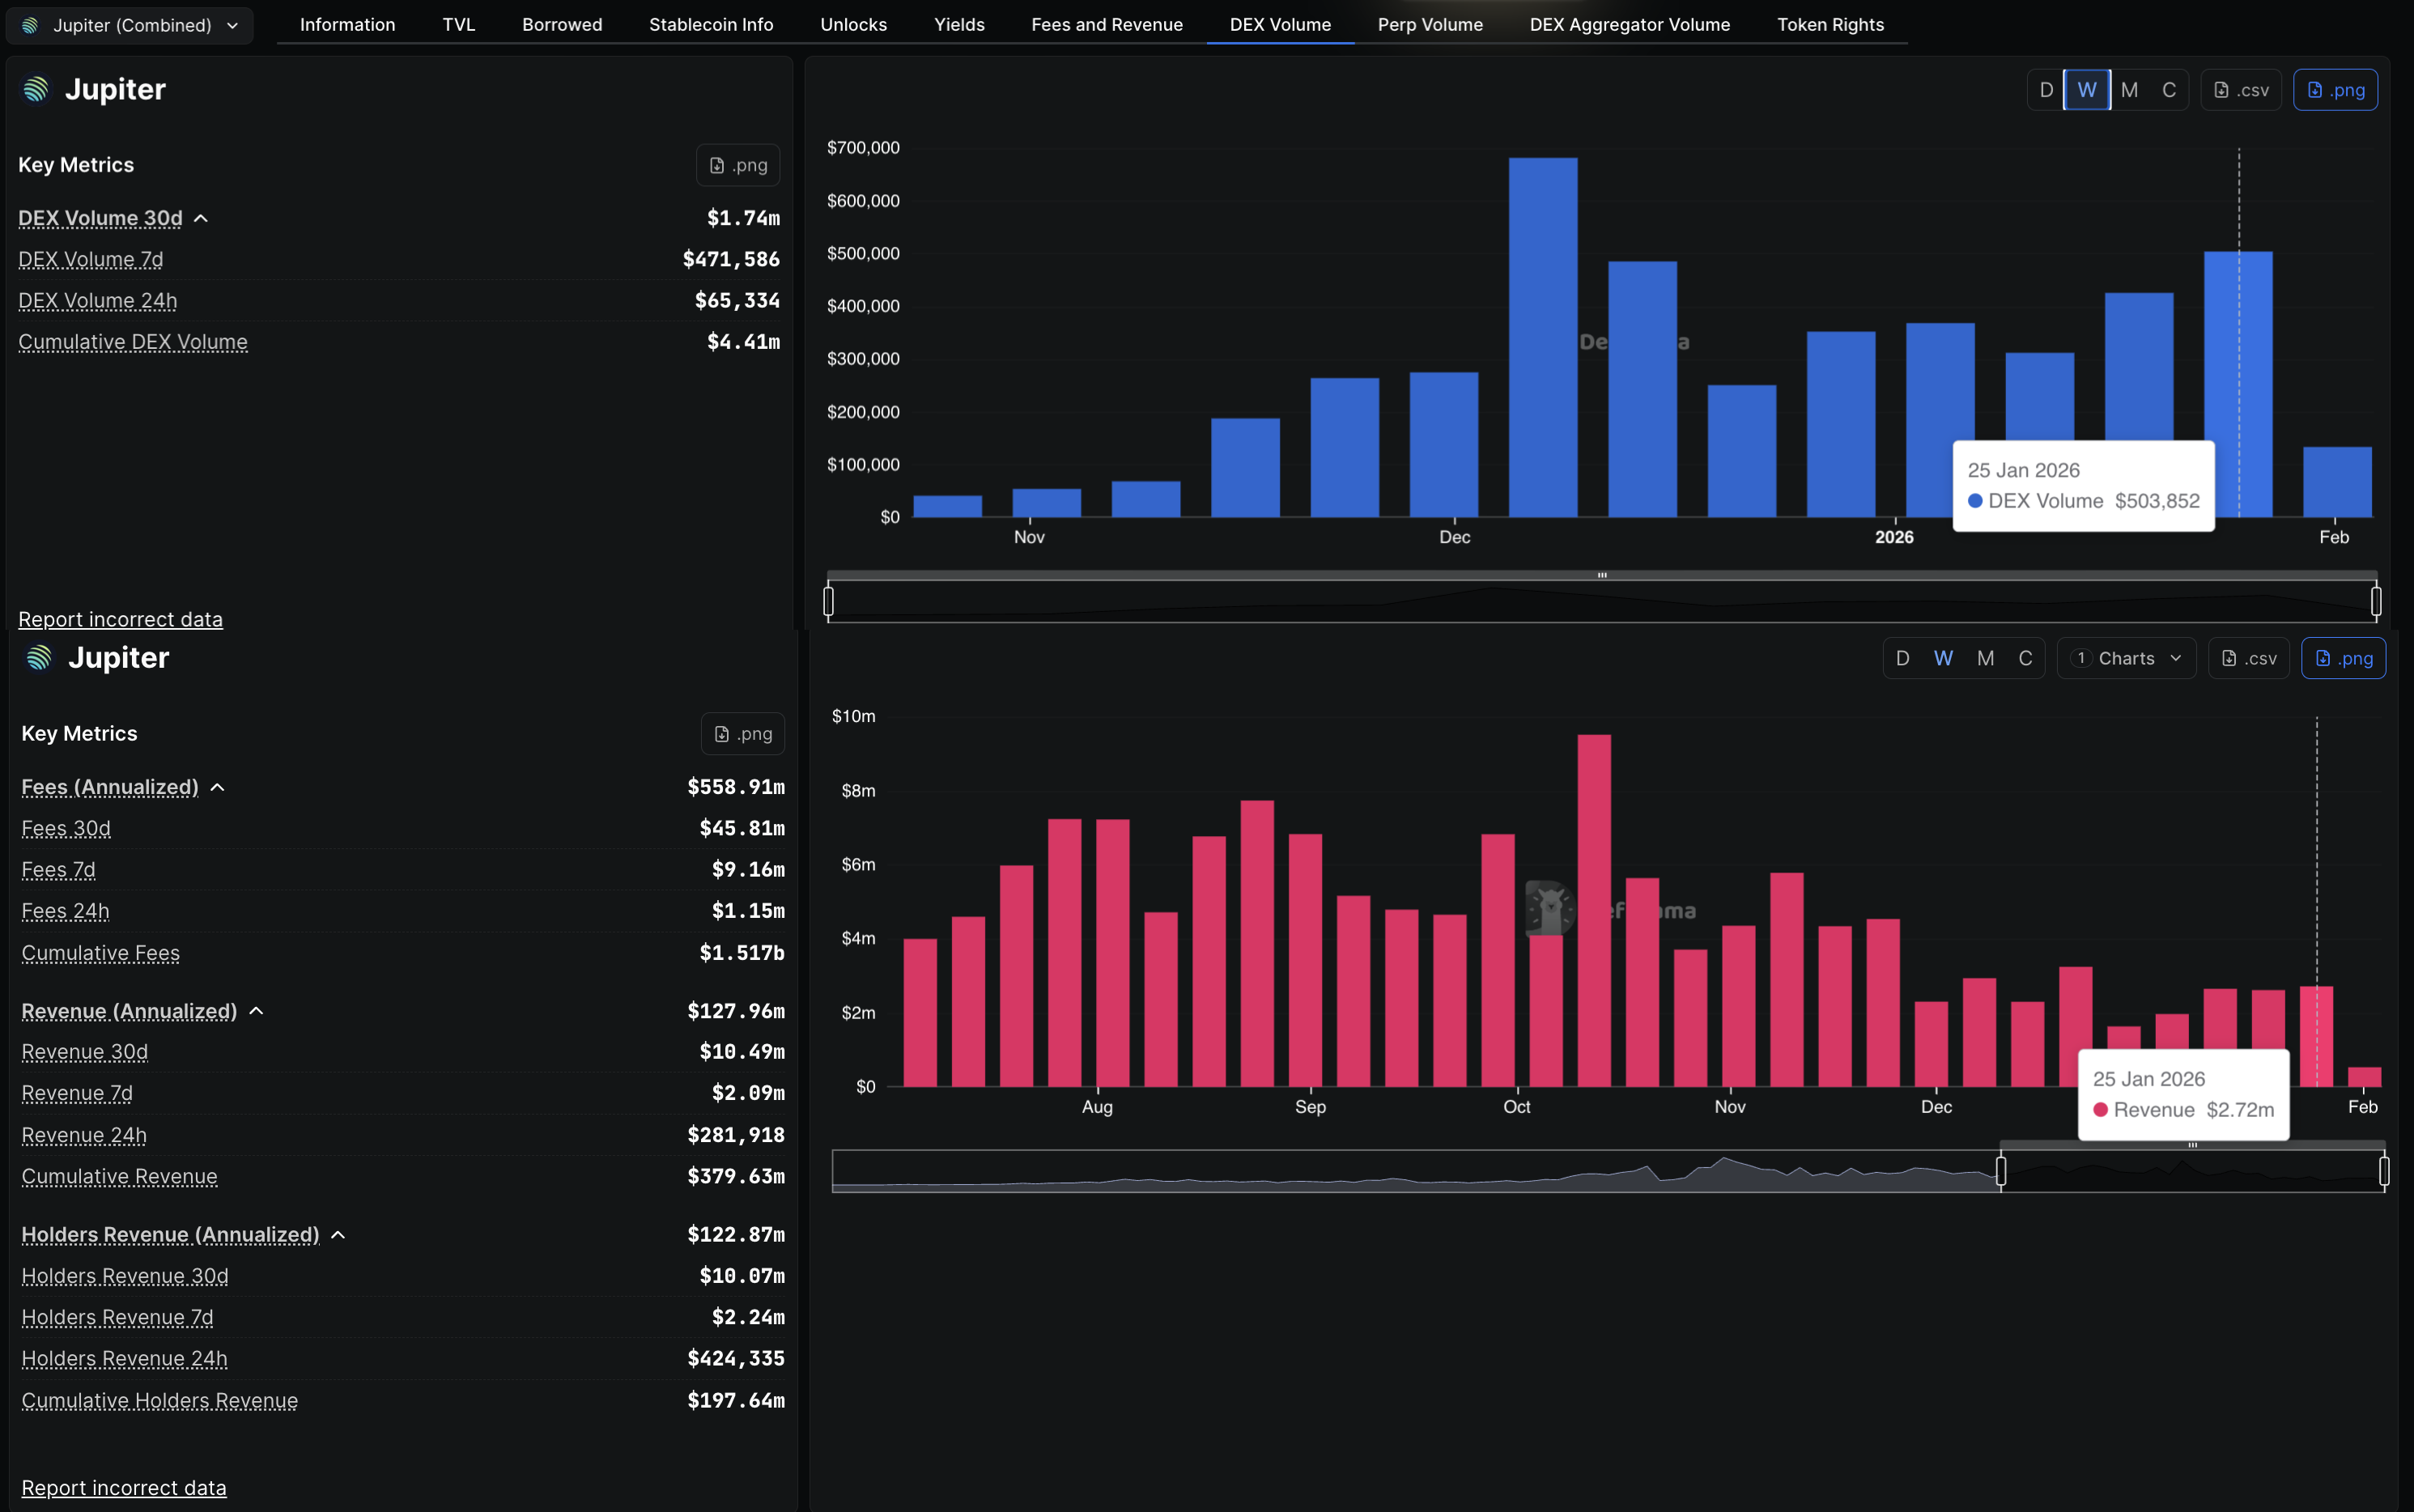
DeFiLlama data shows Jupiter’s revenue exceeding $2.60 million over the last three weeks, while DEX volume increased to $503,852 last week, up from $425,680 in the previous one. The data implies consistent growth in user interaction, which could continue in the coming weeks after its integration on Coinbase.
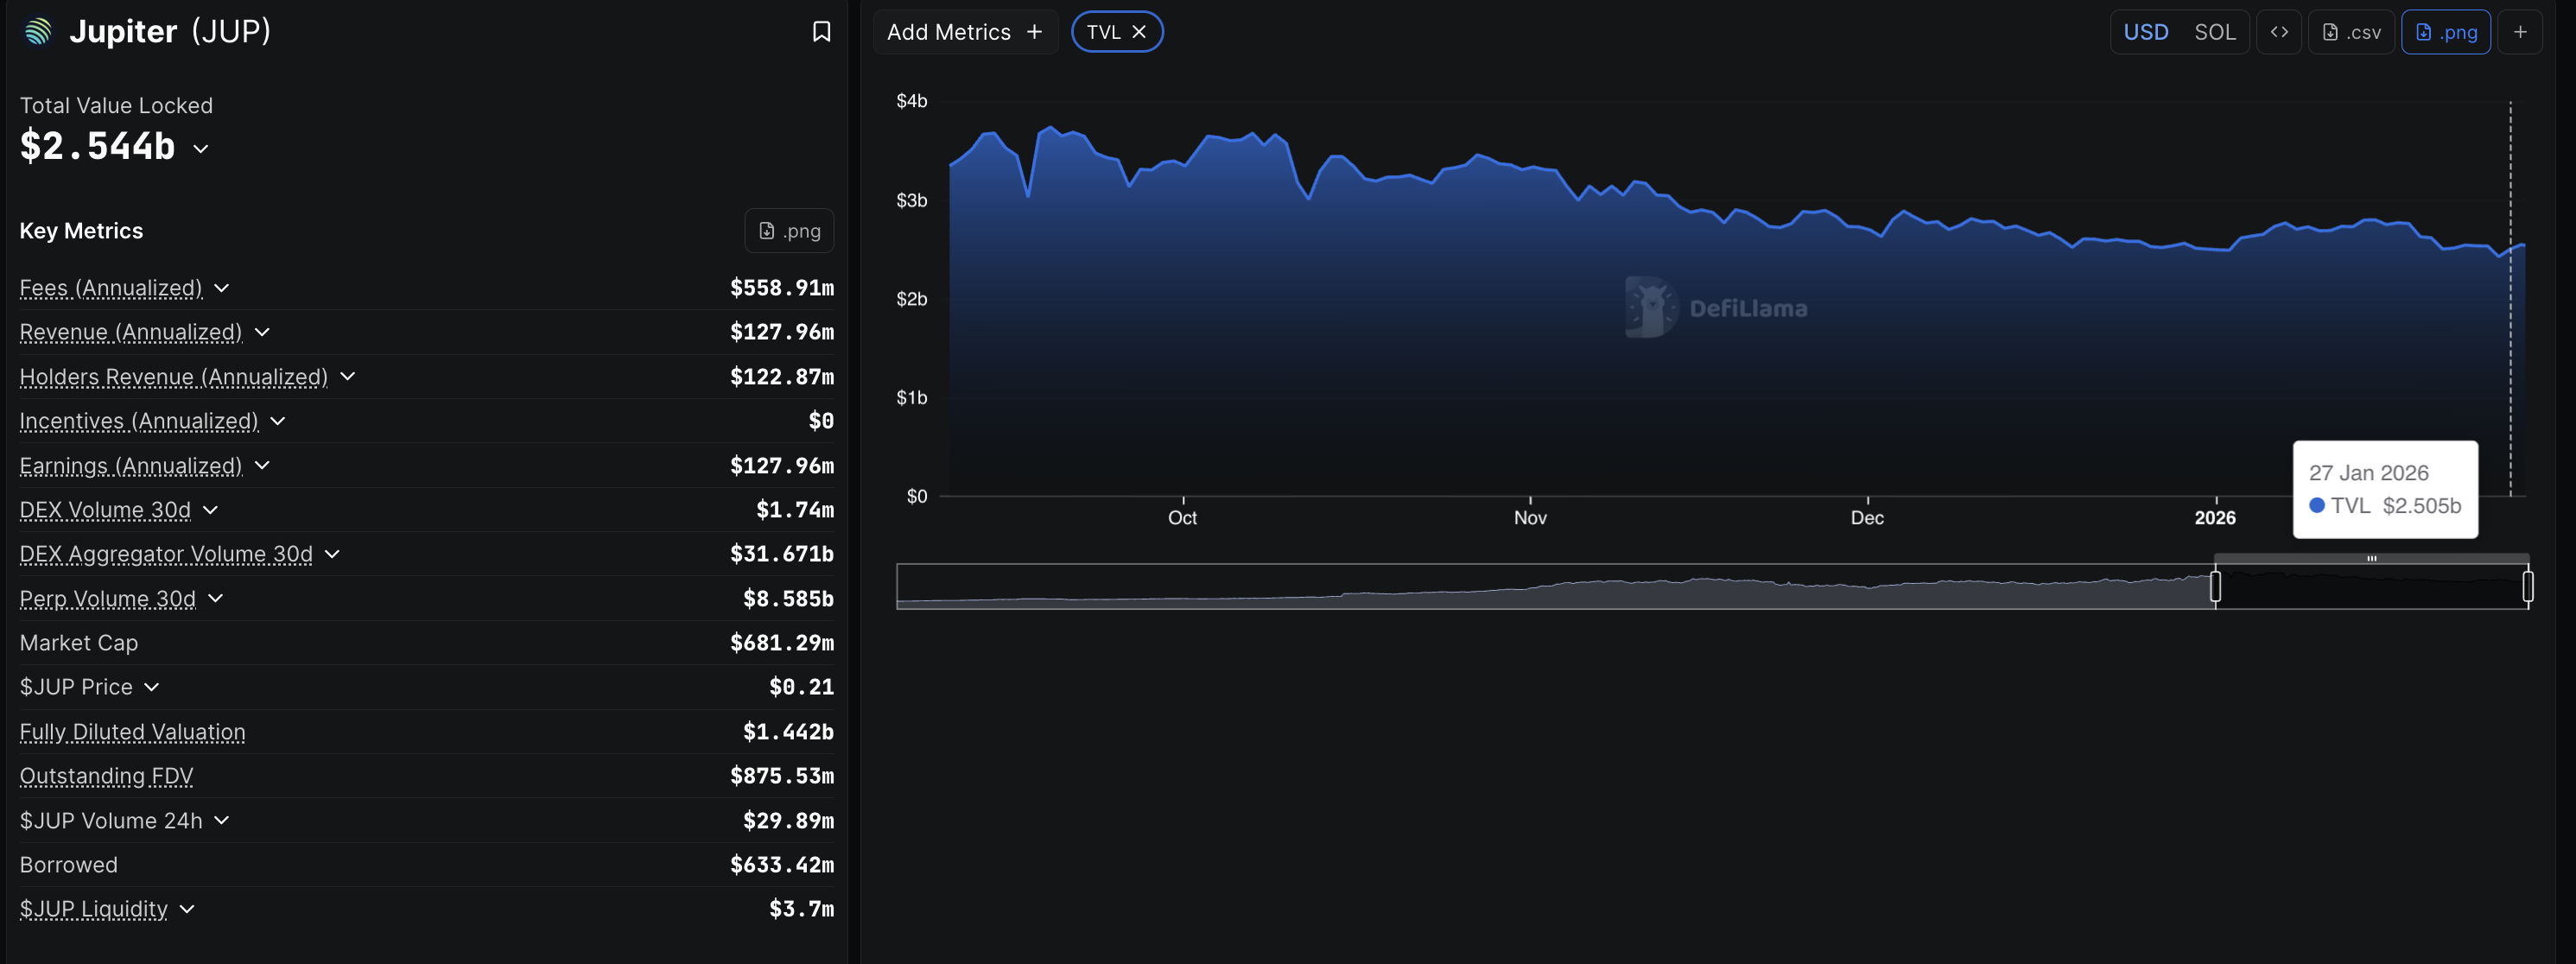
In line with improved network demand, the Total Value Locked (TVL) on Jupiter stands at $2.544 billion, up from $2.505 billion on Tuesday, suggesting that user deposits on the platform have increased.
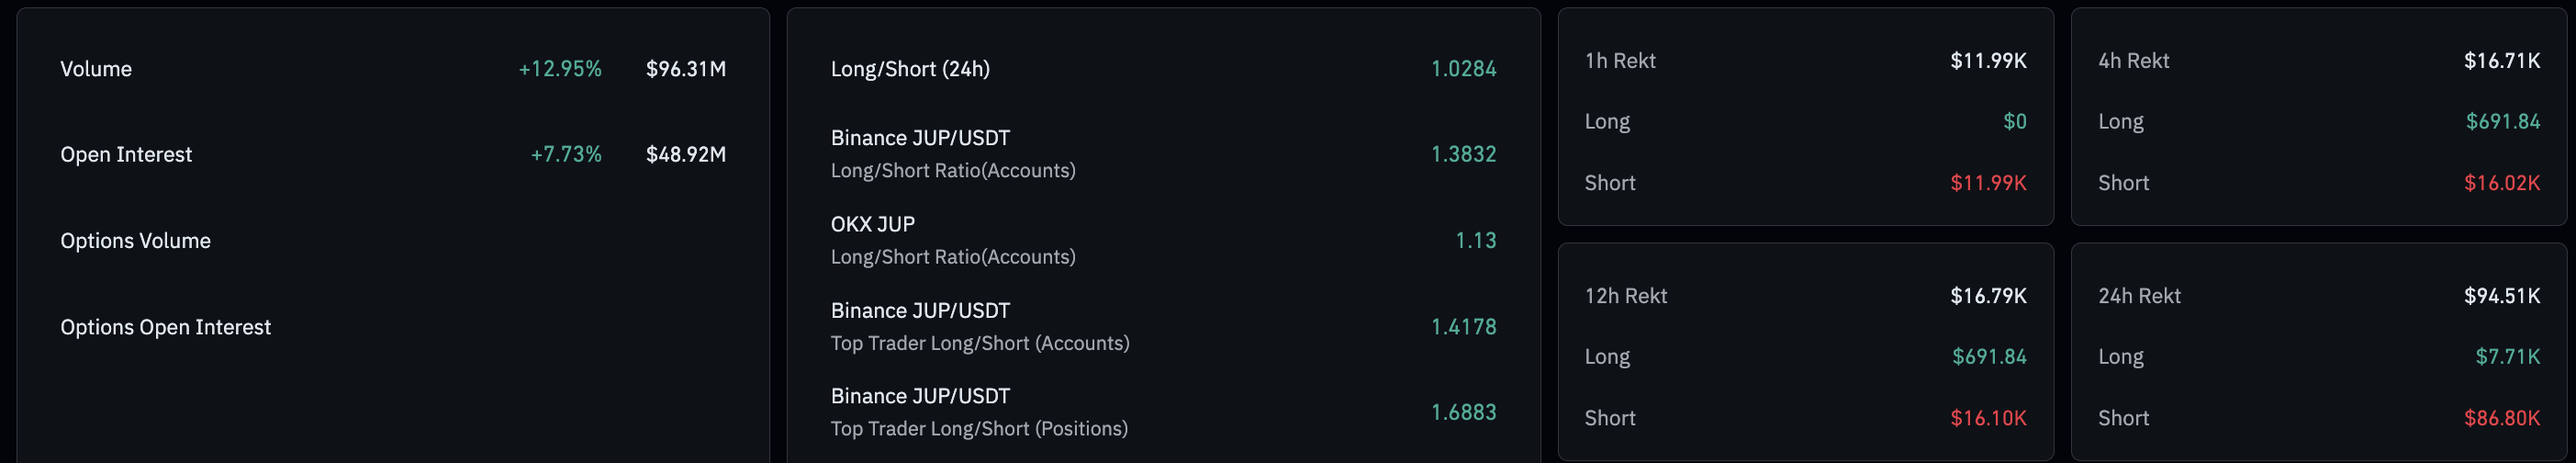
Meanwhile, in the derivatives market, Jupiter futures are seeing increased capital inflows amid a bearish positional wipeout. CoinGlass data shows JUP Open Interest (OI) is up 7.73% over the last 24 hours, reaching $48.92 million, reflecting growth in the outstanding contract value as traders increase their exposure. At the same time, the short liquidations of $86,800 outpace long liquidations of $7,710, reflecting a larger wipeout of bearish positions.
Technical outlook: Will Jupiter rally hit $0.2600?
Jupiter is trading above the 50-day Exponential Moving Average (EMA) at $0.2179, while the 100-day and 200-day EMAs slope lower, signaling a long-term bearish trend despite the recent uptick.
A daily close above the 50-day EMA at $0.2178 and the supply zone between $0.2240 and $0.2308 could extend the rally toward the resistance barriers near the November 17 low at $0.2588 and the 100-day EMA at $0.2604.
Technical indicators on the daily chart suggest a bullish shift in momentum, consistent with Jupiter’s 20% rally so far this week. The Moving Average Convergence Divergence (MACD) crosses above the signal line and under the zero mark, as histogram bars flip positive, suggesting renewed bullish momentum. The Relative Strength Index (RSI) at 59 edges higher, and it still has room before reaching the overbought zone, indicating increasing buying pressure.
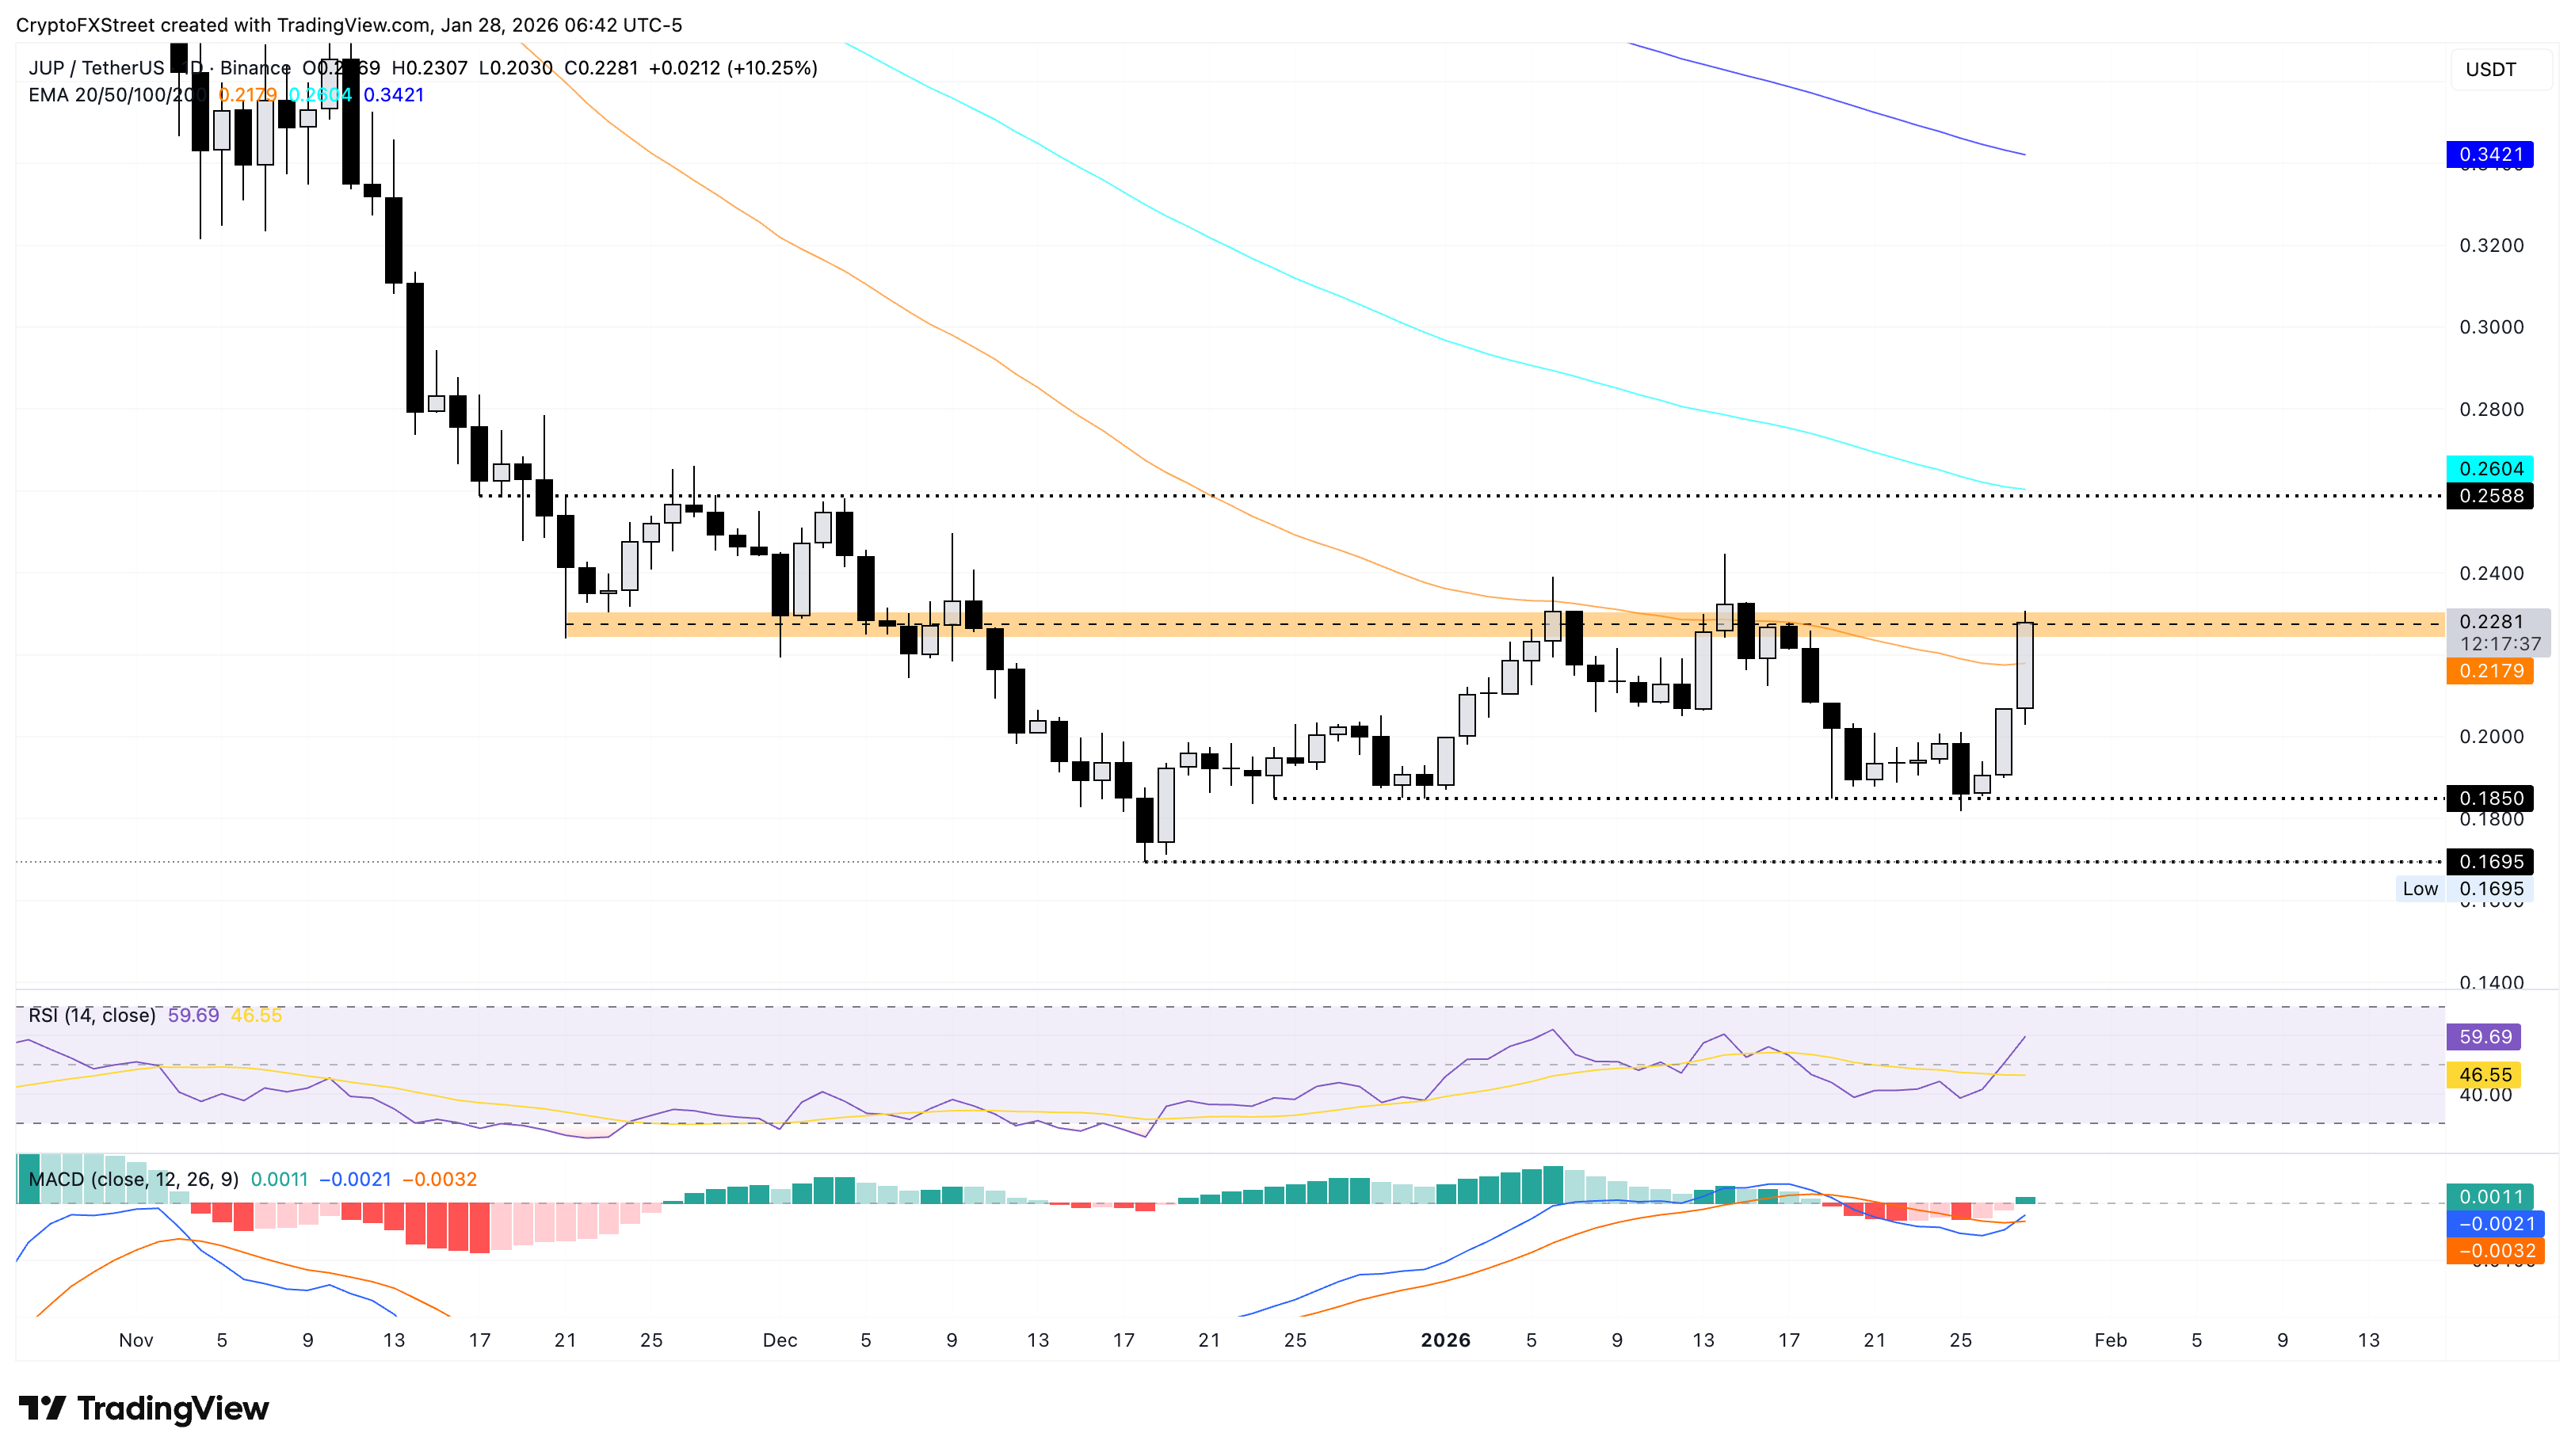
On the downside, if JUP fails to hold above the 50-day EMA at $0.2178, it could threaten the $0.2000 round figure. Deeper support emerges at $0.1850, which aligns with the December 24 low.
Recommended Articles


Comments (0)
Click the $ button, enter the symbol, and select to link a stock, ETF, or other ticker.