


BHP Group Ltd Stock (BHP) Moved Up by 3.25% on Sep 30: What Investors Need To Know



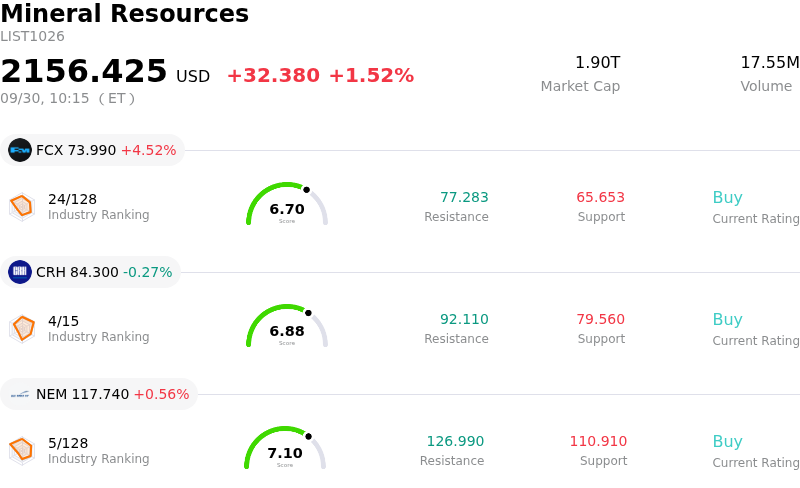
BHP Group Ltd (BHP) moved up by 3.25%. The Mineral Resources sector is up by 1.52%. The company outperformed the industry. Top 3 stocks by turnover in the sector: Freeport-McMoRan Inc (FCX) up 4.52%; CRH PLC (CRH) down 0.27%; Newmont Corporation (NEM) up 0.56%.
What is driving BHP Group Ltd (BHP)’s stock price up today?
BHP Group experienced positive trading momentum driven by a combination of firming commodity market dynamics and operational updates across its primary extraction operations. Investor confidence was bolstered by stability in the industrial metals complex, particularly copper, where tight global refined inventories and ongoing structural demand from energy transition infrastructure continue to support underlying realization prices. A major contributor to the day's market action was the progression regarding operational continuity at the Escondida mine in Chile, where management's update on assessing operational readiness and resuming activities following a brief suspension helped ease worst-case supply disruption fears.
From a structural perspective, copper has grown into a major profit center for BHP, offering a strategic complement to its foundational iron ore segment. While bulk commodities like iron ore face periodic volatility linked to Chinese industrial production cycles and pre-holiday inventory adjustments, underlying demand from emerging economies and disciplined global seaborne supply have helped maintain a steady revenue foundation. The market continues to view BHP's exposure to critical minerals favorably, as secular growth in global electrification and power grid expansion creates a constructive multi-year pricing environment for its key asset base.
The intraday volatility observed in the equity reflects elevated institutional activity as market participants digest operational headlines alongside ongoing labor negotiations at key Latin American facilities. Despite these short-term friction points, institutional sentiment remains supported by BHP's strong operational cash flows, lean leverage metrics, and consistent capital return framework. Today's upward movement underscores how favorable commodity price realization and fundamental supply-demand dynamics are overriding transient operational headwinds in driving share valuation.
Technical Analysis of BHP Group Ltd (BHP)
Technically, BHP Group Ltd (BHP) shows a MACD (12,26,9) value of -0.273, indicating a sell signal. The RSI at 52.060 suggests neutral condition and the Williams %R at 10.409 suggests overbought condition. Please monitor closely.
Fundamental Analysis of BHP Group Ltd (BHP)
BHP Group Ltd (BHP) is in the Mineral Resources industry. Its latest annual revenue is $58.76B, ranking 2 in the industry. The net profit is $9.83B, ranking 2 in the industry. Company Profile
Over the past month, multiple analysts have rated the company as Hold, with an average price target of $75.92, a high of $91.00, and a low of $61.50.
More details about BHP Group Ltd (BHP)
Company Specific Risks:
- Escondida Operational Shutdown and Union Strike Threats: Following a fatal maintenance accident at the Escondida copper mine in Chile—BHP's primary EBITDA contributor—all operational activities were suspended pending regulatory safety clearances. This disruption is compounded by imminent labor actions, as the supervisor union urged its members to vote for strike action between September 28 and 30 after rejecting management's latest pay offer.
- FY27 Copper Output Reductions and Heavy CapEx Pressure: Forward operational guidance indicates a significant step-down in total copper production to between 1,650 and 1,800 kt for FY27 (down from 1,953 kt in FY26) due to structural ore grade depletion at key Chilean assets. This volume contraction threatens margin compression while total capital expenditure remains high at $11 billion.
- Samarco Litigation Liabilities and Potash Impairment Drag: Persistent liability risks from ongoing UK court proceedings and settlement commitments related to the Samarco dam failure continue to require substantial cash settlements (~$900 million), while execution hurdles and a $2.3 billion asset write-down on the Jansen potash project continue to suppress net financial results.
- Analyst Downgrades and Dividend Sustainability Risks: Wall Street research updates have downgraded the stock to Hold, highlighting weak forward EPS growth expectations of just 0.60%, elevated valuation multiples, and an inflated dividend payout ratio near 77.5% that threatens the sustainability of future shareholder payouts.
This article may include AI-generated content that is human-reviewed, which is for reference and general information purposes only and does not constitute investment advice.
Recommended Articles









Comments (0)
Click the $ button, enter the symbol, and select to link a stock, ETF, or other ticker.