


Ethereum (ETHUSD) Volatility Intensified on Sep 29: What You Should Know



Ethereum (ETHUSD) is down 1.14% at Sep 29 22:35(ET), now at $2649.79, with a 7-day down of 3.61%.
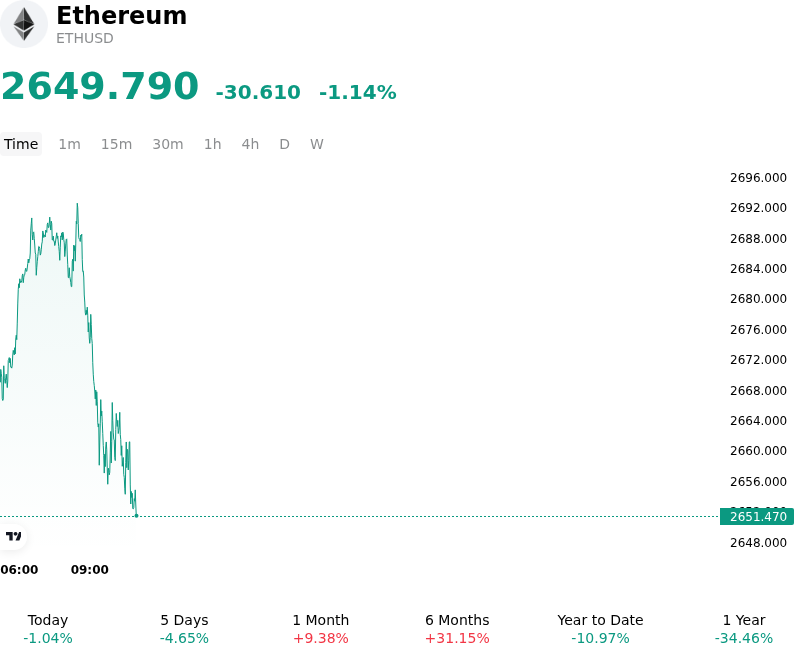
What is driving Ethereum (ETHUSD)’s stock price down today?
Ethereum experienced a pull back as price action encountered firm overhead resistance near the key technical supply zone around the upper boundary of its recent trading range. Following a robust quarterly expansion that outpaced broader digital asset benchmarks, buyers met persistent sell liquidity at these multi-week highs. The inability to clear this key psychological threshold triggered short-term profit-taking and tactical portfolio rebalancing among both institutional and retail market participants.
Macroeconomic headwinds further constrained risk appetite across the broader digital asset ecosystem. U.S. Treasury yields remained elevated following robust economic data and persistent inflation expectations, lifting benchmark yields and reinforcing U.S. dollar strength. Higher real yields and lingering uncertainty regarding the Federal Reserve’s interest rate trajectory tightened macro liquidity conditions, capping speculative enthusiasm and encouraging traders to trim exposure in non-yielding risk assets.
Market structure dynamics amplified the intraday downside momentum through an unwinding of speculative leverage. Derivatives indicators showed a noticeable contraction in perpetual futures open interest and a decline in estimated leverage ratios across major exchanges. This flush of leveraged long positions occurred alongside a temporary moderation in spot Ethereum ETF net inflows, which had previously provided consistent buying pressure. With spot market liquidity relatively thin, modest selling volume was able to absorb resting bid orders, accelerating the downward drift.
Despite the short-term profit-taking, structural tailwinds continue to support the long-term outlook for the asset. High network staking participation and ongoing corporate treasury accumulation keep a significant portion of the total circulating supply locked on-chain, mitigating downside liquid float. Additionally, steady developer progress on upcoming network scalability upgrades and sustained Layer-2 adoption continue to bolster network utility. Market participants remain focused on macroeconomic liquidity shifts, spot ETF flow sustainability, and crucial technical support levels to assess whether this movement reflects routine price consolidation or a broader pause in institutional positioning.
Technical Analysis of Ethereum (ETHUSD)
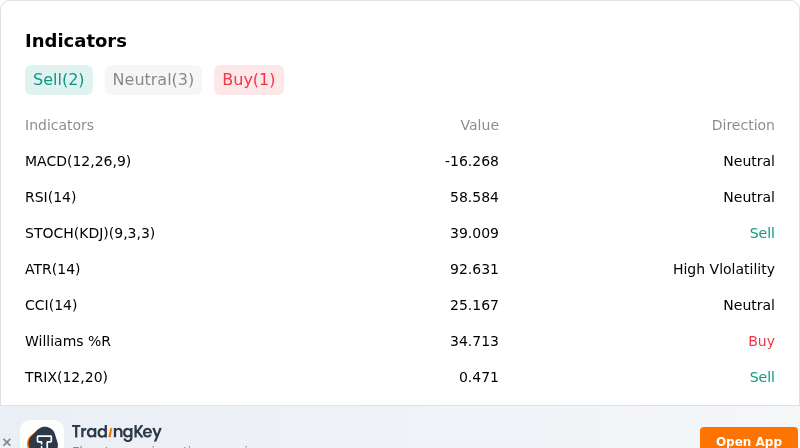
Technically, Ethereum (ETHUSD) shows a MACD (12,26,9) value of -16.268, indicating a neutral signal. The RSI at 58.584 suggests neutral condition and the Williams %R at 34.713 suggests buy condition. Please monitor closely.
More details about Ethereum (ETHUSD)
Recent Events and Risks:
- Derivatives Long Squeeze and Cascade Liquidations: Overextended leverage following Ethereum's retest of overhead resistance near $2,780–$2,800 triggered tens of millions of dollars in long-side liquidations across perpetual futures venues, exacerbating intraday order book slippage and pressing spot prices toward key technical support levels.
- Spot ETF Net Outflows and Institutional Capital Drag: Spot Ethereum exchange-traded funds have recorded periodic net redemption sessions, demonstrating a temporary slowdown in institutional capital allocations that weakens the structural bid necessary to absorb ongoing spot market selling.
- Legislative Delays and Whale Distribution: Policy uncertainty stemming from legislative inertia in the U.S. Senate regarding digital asset framework bills (such as the CLARITY Act) triggered short-term token distribution by mid-tier whale holders, increasing circulating supply on exchanges.
- Macro Risk-Off Shift and Geopolitical Headwinds: Geopolitical friction alongside elevated U.S. Treasury yields and firming oil prices have spurred a broader risk-off environment, shifting investor capital toward defensive yield-bearing assets and pressuring liquidity across cryptocurrency markets.
This article may include AI-generated content that is human-reviewed, which is for reference and general information purposes only and does not constitute investment advice.
Recommended Articles








Comments (0)
Click the $ button, enter the symbol, and select to link a stock, ETF, or other ticker.