


Newmont Corporation Stock (NEM) Moved Down by 3.30% on Aug 13: What Signal Does It Send?



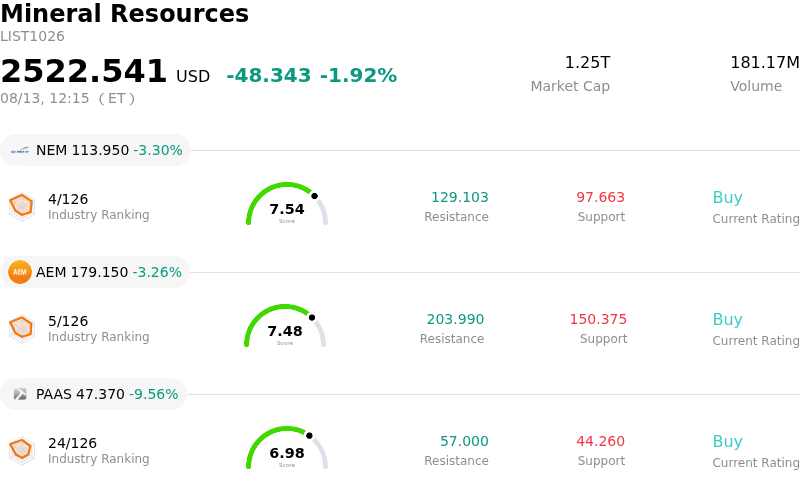
Newmont Corporation (NEM) moved down by 3.30%. The Mineral Resources sector is down by 1.92%. The company underperformed the industry. Top 3 stocks by turnover in the sector: Newmont Corporation (NEM) down 3.30%; Agnico Eagle Mines Ltd (AEM) down 3.26%; Pan American Silver Corp (PAAS) down 9.56%.
What is driving Newmont Corporation (NEM)’s stock price down today?
The recent downward pressure on Newmont Corporation reflects a combination of short-term profit-taking, underlying commodity market consolidation, and broader macroeconomic positioning. After enjoying a multi-session rally that propelled the stock toward multi-month highs on the back of elevated precious metal price levels, momentum naturally cooled as market participants sought to lock in gains. A temporary pause in the broader gold market, coupled with cautious trading ahead of economic data releases influencing Federal Reserve monetary policy expectations, prompted institutional investors to trim exposure in high-beta mining equities.
In addition to technical profit-taking, company-specific developments and fundamental valuation considerations contributed to the stock's retreat. Newmont recently finalized an agreement to resolve outstanding joint venture disputes regarding Nevada Gold Mines, which included a significant cash commitment to consolidate key properties under a revised operational framework. While the transaction strengthens the long-term strategic alignment of these core assets, the immediate capital outlay and expectations of higher all-in sustaining costs in the second half of the year have re-engaged investor focus on near-term execution risks. Furthermore, following the stock's rapid multi-week run, technical indicators entered overbought territory, triggering automated rebalancing and valuation-driven selling.
Despite the intraday pullback, Newmont maintains a resilient operational profile backed by robust free cash flow generation and disciplined capital allocation. However, operational complexities at certain mine sites, persistent inflationary pressure on input costs, and currency fluctuations remain persistent headwinds for the basic materials sector. In the near term, institutional sentiment will likely hinge on the firm's ability to maintain margin discipline during asset integration while navigating broader macroeconomic shifts and commodity price fluctuations.
Technical Analysis of Newmont Corporation (NEM)
Technically, Newmont Corporation (NEM) shows a MACD (12,26,9) value of 6.019, indicating a buy signal. The RSI at 75.722 suggests buy condition and the Williams %R at 7.530 suggests overbought condition. Please monitor closely.
Media Coverage of Newmont Corporation (NEM)
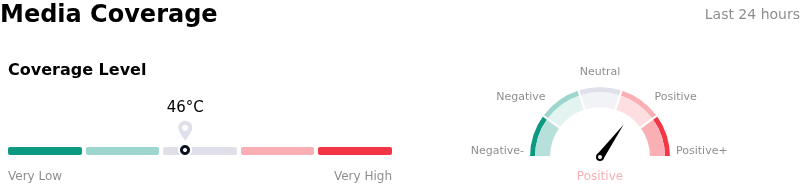
In terms of media coverage, Newmont Corporation (NEM) shows a coverage score of 46, indicating a moderate level of media attention. The overall market sentiment index is currently in bullish zone.
Fundamental Analysis of Newmont Corporation (NEM)
Newmont Corporation (NEM) is in the Mineral Resources industry. Its latest annual revenue is $22.67B, ranking 8 in the industry. The net profit is $7.08B, ranking 3 in the industry. Company Profile
Over the past month, multiple analysts have rated the company as Buy, with an average price target of $132.17, a high of $205.00, and a low of $64.32.
More details about Newmont Corporation (NEM)
Company Specific Risks:
- Substantial Cash Outflow from Joint Venture Settlement: Newmont committed $1.95 billion in cash consideration to Barrick Mining to settle outstanding disputes and incorporate properties into the Nevada Gold Mines joint venture, creating a significant capital outlay and concentrating execution risk within the joint venture's performance.
- Earnings Estimate Downgrades and Operating Cost Inflation: Wall Street analysts, including Zacks Research, cut Q3 2026 earnings per share estimates to $1.92 from $2.19, citing persistent All-In Sustaining Cost (AISC) pressure driven by sticky labor, diesel, and operational maintenance expenses into the second half of the year.
- Executive Insider Share Sales: Recent SEC Form 4 filings highlight executive equity offloading, including Chief Financial Officer Brian Tabolt selling 11,445 shares to reduce his direct position by over 28%, introducing supply pressure and signaling insider profit-taking following recent market gains.
- Production Output Constraints and Operational Fragility: Operating headwinds remain a key threat as full-year production targets remain lower year-over-year at 5.3 million gold ounces, constrained by ongoing operational recovery following seismic interruptions at the Cadia mine and scheduled maintenance halts across core assets.
This article may include AI-generated content that is human-reviewed, which is for reference and general information purposes only and does not constitute investment advice.
Recommended Articles










Comments (0)
Click the $ button, enter the symbol, and select to link a stock, ETF, or other ticker.