


Cisco Stock Retests $101.60 Ahead of Q1 Results, With AI Orders in Focus



AI Podcast


Cisco shares rebounded 2.66% to $100.76 ahead of its fiscal first-quarter earnings, following a recent 20% slide prompted by a Morgan Stanley downgrade. Wall Street expects $18.11 billion in revenue and $1.32 EPS. Key catalysts include accelerating AI infrastructure orders and gross margin durability amid rising hyperscaler demand. Technically, the stock faces a crucial resistance test at $101.60. A daily close above this threshold would signal a bullish short-term reversal toward $107, whereas a rejection risks driving shares down toward support levels at $91.74 and $84.08, keeping the broader trend cautiously neutral.

TradingKey - Cisco Systems (NASDAQ: CSCO) rose 2.66% to $100.76 on Wednesday, November 11, as CoreWeave's results lifted AI hardware stocks, and premarket quotes sit slightly lower at $100.11. Cisco reports fiscal first-quarter results after the US close today.
That bounce follows a month-long slide in which Cisco fell about 20%, including a 7.62% drop on November 5 after a Morgan Stanley downgrade, to close at $93.85 on Friday, November 6. This week's recovery has brought the stock back to the level where that breakdown started.
What Wall Street Expects
Cisco guided first-quarter revenue to $18.0 billion to $18.2 billion and non-GAAP EPS, which excludes items such as stock-based pay, to $1.32 to $1.34. Analysts expect about $18.11 billion and $1.32, which implies about 22% revenue growth and about 32% EPS growth. Over the past 90 days, EPS estimates rose about 15% and revenue estimates about 8%, so the bar has moved higher.
For the full year, which matters more than a first-quarter beat, Cisco expects fiscal 2027 revenue of $72.2 billion to $73.4 billion, up about 14% to 16% from $63.3 billion by my calculation, and non-GAAP EPS of $5.05 to $5.11.
AI Orders Are the Main Test
Last quarter, revenue rose 18% to $17.3 billion and product orders jumped 35%, or 25% excluding hyperscalers, the largest cloud companies. AI infrastructure orders from hyperscalers reached $4.0 billion in the quarter and $9.3 billion for fiscal 2026, and Cisco expects about $7.5 billion of hyperscaler AI infrastructure revenue in fiscal 2027, up from about $4 billion.
Non-GAAP gross margin, the share of revenue left after production costs, was 66.3% last quarter, and Cisco guided 65% to 66% for the first quarter. AI hardware earns less than software and services, so the faster AI grows, the more pressure it puts on margins.
Morgan Stanley Raised the Bar
On November 5, Morgan Stanley's Meta Marshall cut Cisco to Equal-weight and lowered her target to $120 from $135. Morgan Stanley warned that customers ordering early ahead of price increases may be flattering near-term sales, and flagged the growing share of lower-margin hyperscaler hardware. Bernstein's Daniel Zhu holds a Hold rating with a $110 target.
Even after a month of selling, analysts are still mostly positive, with a Moderate Buy consensus of 11 Buys and 8 Holds and an average target of about $137.50. At about 19 times forward earnings, Cisco trades roughly in line with the S&P 500, even though its AI orders more than quadrupled last year.
Cisco Technical Analysis: Daily Close Above $101.60 Could Open $107
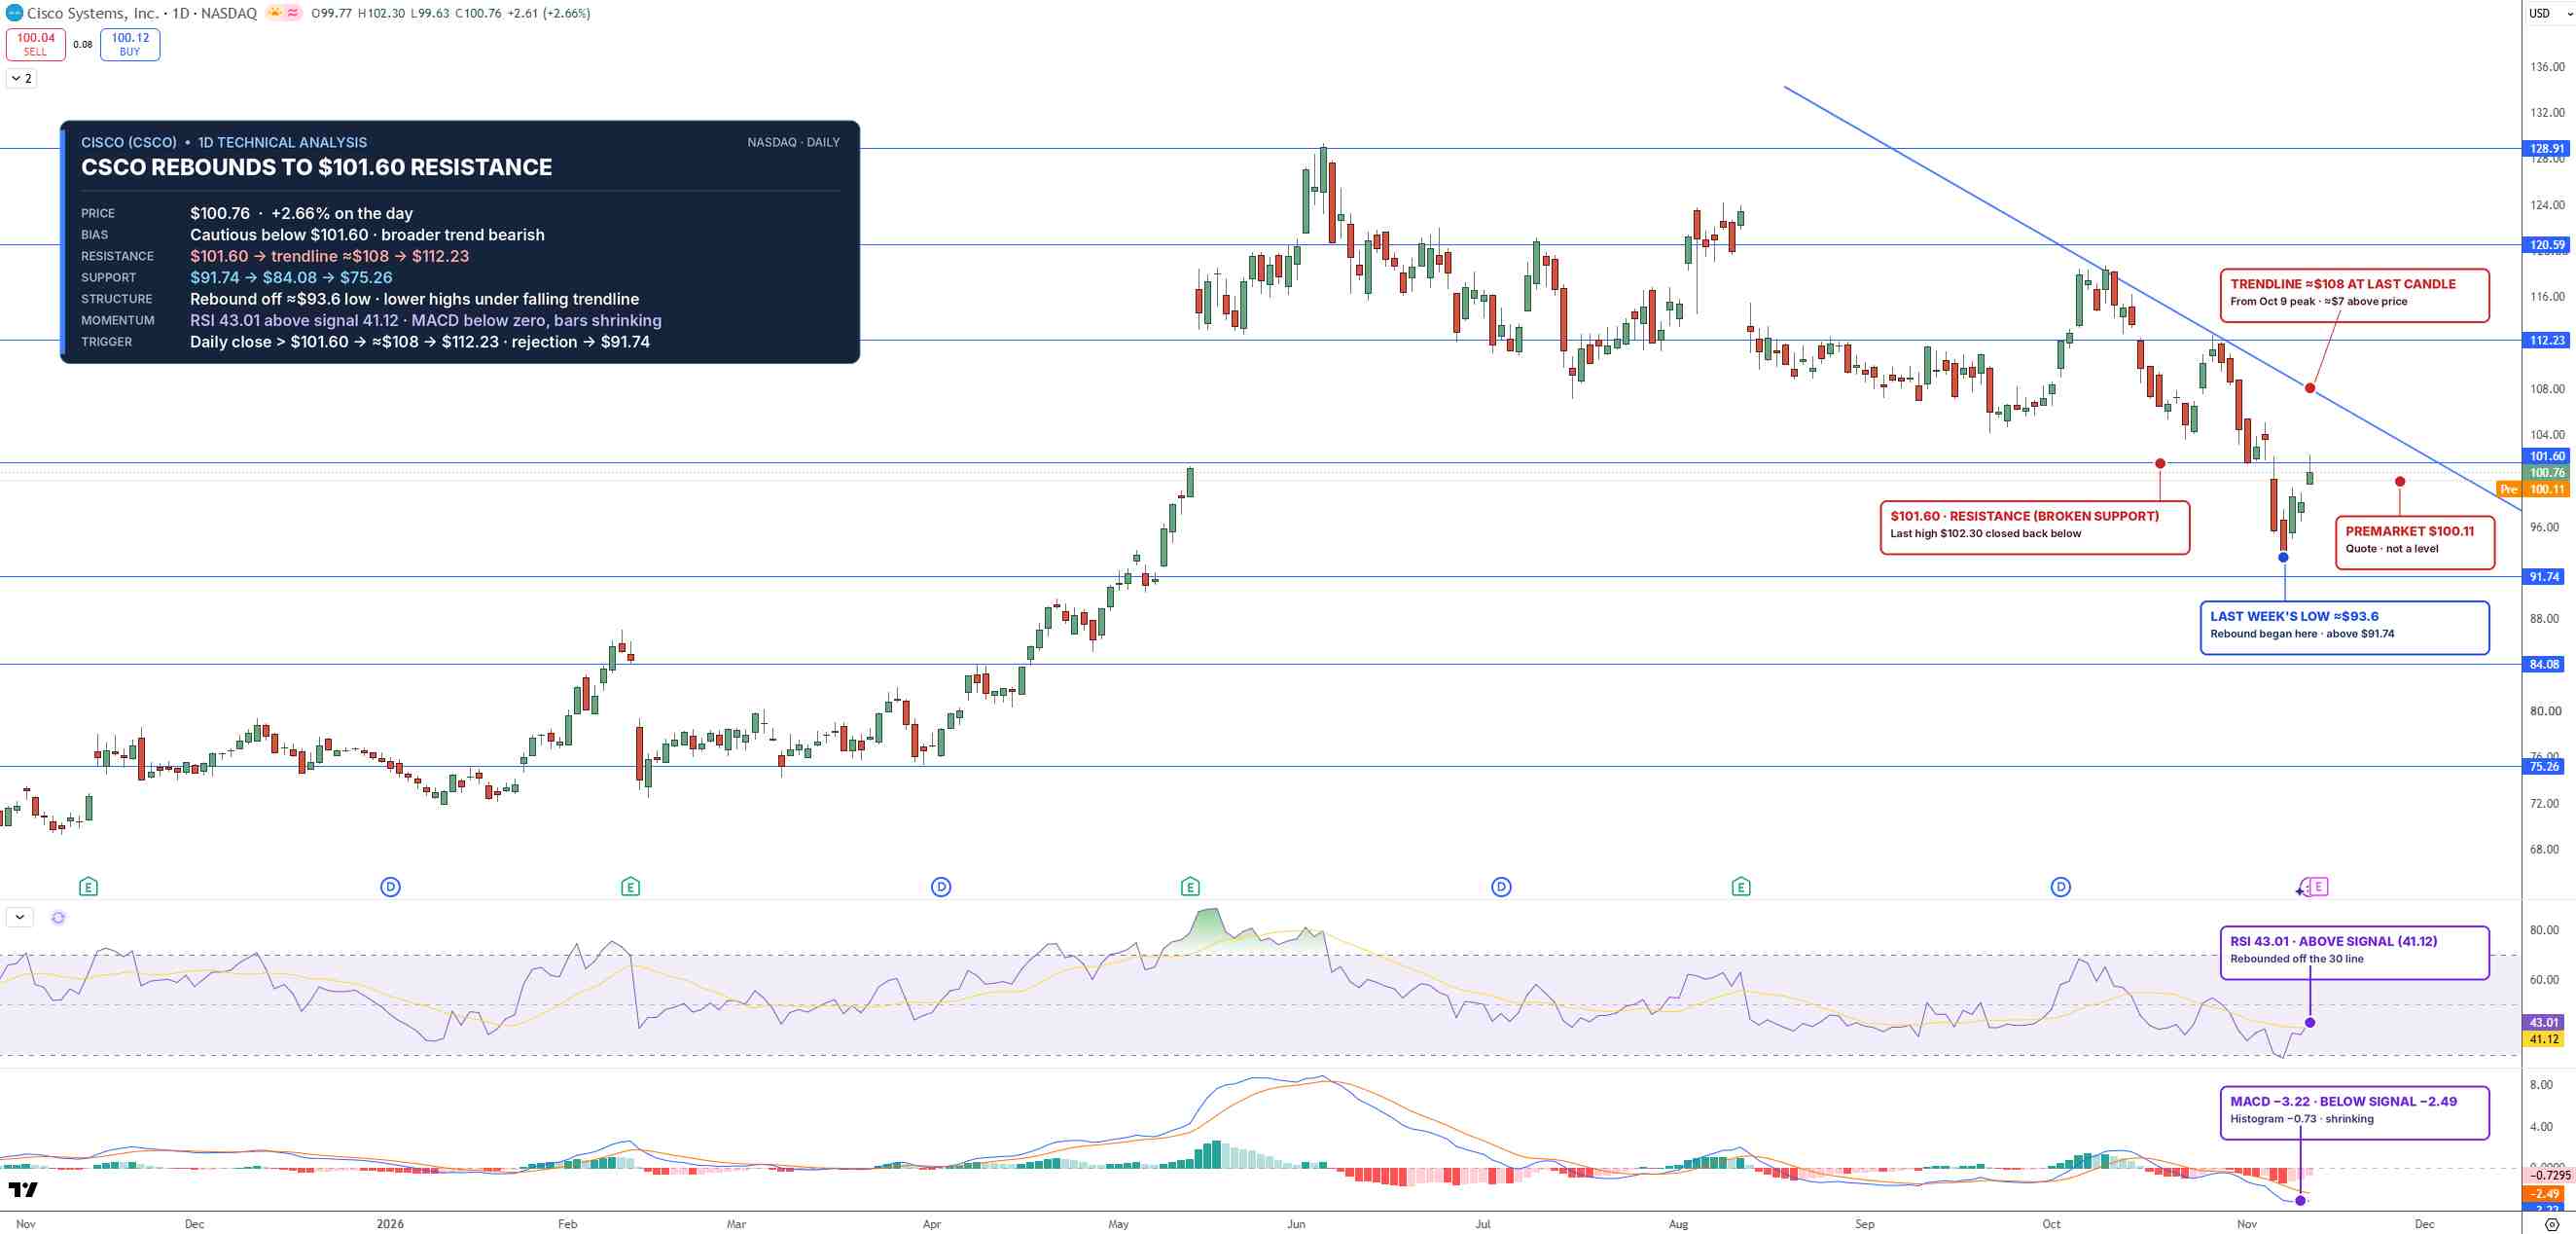
That recovery shows clearly on the daily chart. Buyers have lifted the stock off last week's low near $93, and price is now testing $101.60, the support level that broke in early November. Former support often turns into resistance, a ceiling where sellers return, so this is an important test. The broader trend is still bearish, with lower highs under a falling trendline from the October peak, a line drawn across those highs.
RSI, a momentum gauge that runs from 0 to 100, has climbed to about 43. The MACD, another momentum indicator, is still negative, but its bars are shrinking, which shows selling pressure is easing.
CSCO Price Chart - Source: Tradingview
A daily close above $101.60 could open the falling trendline near $107, followed by $112.23. A rejection here could send CSCO back toward $91.74, followed by $84.08.
I'm cautiously neutral while CSCO trades below $101.60, and a close above it would turn the short-term outlook bullish.
Key Levels
- Last close: $100.76, up 2.66% on Wednesday, November 11 (premarket: $100.11)
- Support: $91.74, $84.08
- Resistance: $101.60, $107.00, $112.23
- RSI: 43.01
- Bullish trigger: Daily close above $101.60
- Bearish trigger: Daily close below $91.74
FAQs
What does Wall Street expect from Cisco's Q1 earnings?
Analysts expect revenue of about $18.11 billion and non-GAAP EPS of about $1.32, within Cisco's guidance of $18.0 billion to $18.2 billion and $1.32 to $1.34. Investors will focus on hyperscaler AI orders and gross margin.
What is the Cisco stock forecast now?
The bias is cautiously neutral below $101.60 on the daily chart. A daily close above $101.60 opens the falling trendline near $107 and then $112.23, while a rejection could send CSCO toward $91.74 and $84.08.
Bottom Line
Cisco's AI orders are growing fast, but the market wants proof that early ordering is not flattering the numbers and that margins can hold. The level that matters is $101.60. In my view, a daily close above it after the report would turn the short-term picture bullish, while a rejection would put $91.74 back in play.
Recommended Articles








Comments (0)
Click the $ button, enter the symbol, and select to link a stock, ETF, or other ticker.