


STMicroelectronics NV Stock (STM) Closed Up by 5.30% on Aug 7: Key Drivers Unveiled



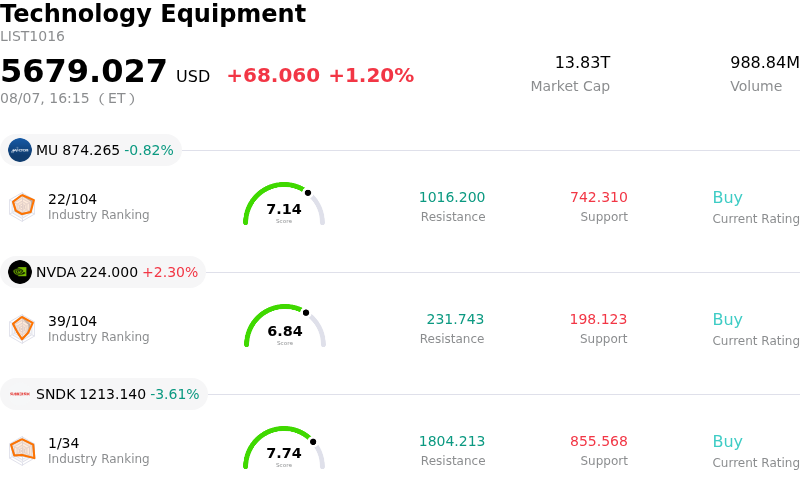
STMicroelectronics NV (STM) closed up by 5.30%. The Technology Equipment sector is up by 1.20%. The company outperformed the industry. Top 3 stocks by turnover in the sector: Micron Technology Inc (MU) down 0.82%; NVIDIA Corp (NVDA) up 2.30%; SanDisk Corporation (SNDK) down 3.61%.
What is driving STMicroelectronics NV (STM)’s stock price up today?
The sharp upward trajectory in STMicroelectronics today reflects a significant shift in investor confidence regarding the bottoming out of the industrial and automotive semiconductor cycles. Market participants are reacting positively to signs that inventory corrections among major European and Asian car manufacturers have concluded sooner than anticipated. This recovery narrative is being bolstered by reports of increased order intake for next-generation power modules, particularly those integrated into mid-to-high-end electric vehicle platforms.
Furthermore, the company has benefited from a broader rally across the semiconductor equipment and materials sector following a series of optimistic analyst upgrades. Several prominent research firms have revised their outlook on the power electronics market, citing STMicroelectronics as a primary beneficiary of the transition to silicon carbide technology. The announcement of a new long-term supply agreement with a leading global automotive conglomerate has acted as a catalyst, reinforcing the company's dominant market share in high-voltage applications.
On the macroeconomic front, cooling inflationary data has led to a recalibration of interest rate expectations, favoring capital-intensive growth stocks in the technology sector. As institutional investors rotate back into high-quality cyclicals, STMicroelectronics has seen a notable influx of buy-side activity. This institutional interest is likely driven by the company's resilient margins and its strategic focus on diversified revenue streams, which provide a buffer against localized economic slowdowns.
Despite the intraday volatility, the underlying demand for intelligence at the edge and energy-efficient power solutions remains a robust long-term tailwind. The current movement suggests that the market is now pricing in a faster margin expansion through the latter half of the fiscal year. However, risks remain regarding geopolitical trade tensions and potential fluctuations in the consumer electronics segment, which continue to warrant a cautious but optimistic monitoring of the stock's performance.
Technical Analysis of STMicroelectronics NV (STM)
Technically, STMicroelectronics NV (STM) shows a MACD (12,26,9) value of -0.241, indicating a sell signal. The RSI at 39.949 suggests neutral condition and the Williams %R at 71.046 suggests sell condition. Please monitor closely.
Fundamental Analysis of STMicroelectronics NV (STM)
STMicroelectronics NV (STM) is in the Technology Equipment industry. Its latest annual revenue is $11.80B, ranking 17 in the industry. The net profit is $166.00M, ranking 36 in the industry. Company Profile
Over the past month, multiple analysts have rated the company as Buy, with an average price target of $61.02, a high of $98.00, and a low of $25.87.
More details about STMicroelectronics NV (STM)
Company Specific Risks:
- Severe Technical Breakdown and Sell-Side Downgrades: As of August 5-6, 2026, technical indicators have shifted to a "Sell Candidate" status with a score of -2.24; the stock has broken major support at $51.88, with current MACD sell signals and Bollinger Band intervals suggesting a further 10.32% downside over the immediate term.
- Escalating Financial Solvency Concerns: Quantitative risk modeling on August 6, 2026, has flagged "bankruptcy risk for the current cycle" as a primary concern, supported by a negative Sharpe ratio of -0.0078 and a Total Risk Alpha of -0.77, indicating the company is failing to generate returns relative to its 75% implied volatility.
- Liquidity Strain from Negative Free Cash Flow: Financial filings reveal a negative free cash flow of $723 million for the most recent reporting period, exacerbated by a massive $895 million cash-out for the NXP MEMS sensor acquisition and elevated capital expenditures ($2.0–2.2 billion guidance) that threaten near-term cash reserves.
- Critical Margin Compression and Core Profit Miss: Institutional sentiment remains bearish following a significant miss in core profit ($679 million vs. $798 million expected) and a cautious Q3 revenue guidance of $3.70 billion; analysts cite a slower-than-expected ramp-up for the iPhone 18 and persistent industrial inventory corrections as fundamental business model weaknesses.
This article may include AI-generated content that is human-reviewed, which is for reference and general information purposes only and does not constitute investment advice.
Recommended Articles








Comments (0)
Click the $ button, enter the symbol, and select to link a stock, ETF, or other ticker.