

Dow Jones Industrial Average wins the week by playing defence

- DJIA is the only major US index pacing for a weekly gain, holding up while technology shares slumped.
- The advance reflects defensive rotation into healthcare, staples and utilities, not broad risk appetite.
- A hawkish turn in rate expectations and a fraying Iran ceasefire are the downside risks the index is currently ignoring.
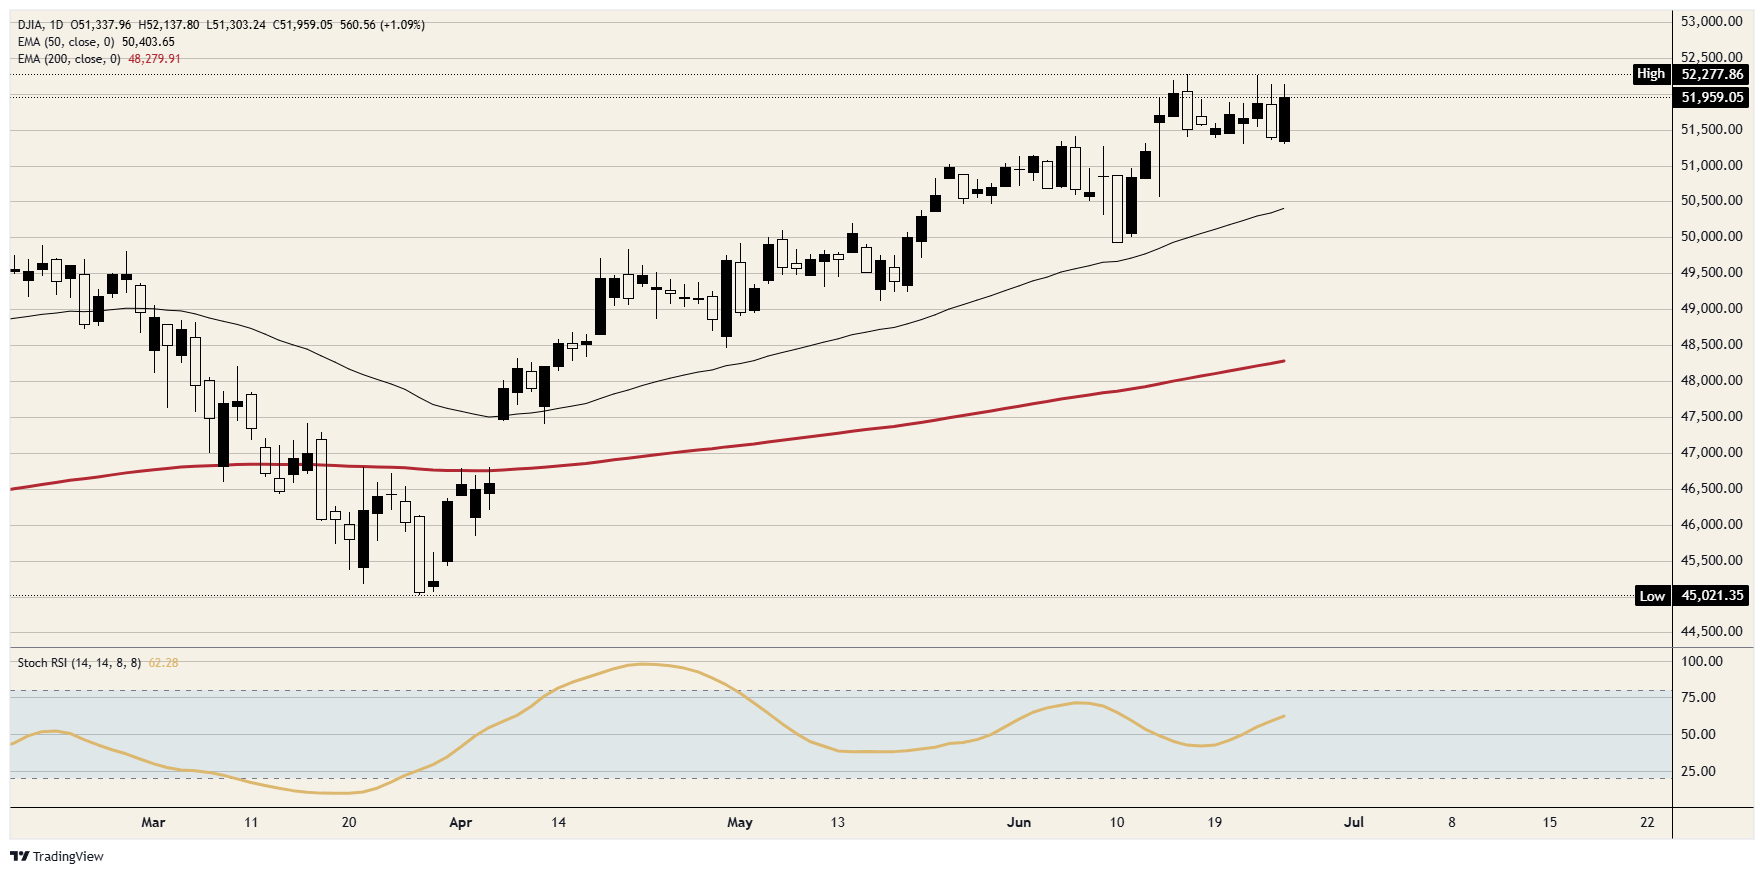
The Dow Jones Industrial Average (DJIA) is closing the week as the last major US index standing, having rallied more than 1% to settle just below 52,000, with the record high near 52,300 still in view. That reads as strength until you ask where the buying is coming from. The bid is not conviction; it is a flight out of a brutal technology selloff into anything defensive, and the Dow is simply where the money chose to hide.
A rally made of what investors are running from
The sector breakdown gives the defensive game away: healthcare did the heavy lifting, with the major drug makers up between roughly 2% and 6%, while consumer staples, financials and utilities all closed higher. That is the textbook signature of investors buying safety rather than chasing growth, and the Dow's heavier weighting toward old-economy names is precisely why it outran the rest of the board.
On the other side of the ledger, information technology dropped close to 1% after a report that OpenAI may push its market debut into next year, reviving doubts about how durable the sector's vast infrastructure spending really is. The damage was uglier abroad, where SoftBank, a key backer of that buildout, plunged more than 12% and Asian chip names were routed. Light on megacap semiconductors and stuffed with defensives, the DJIA stepped around the wreckage.
A policymaker swaps the cut for a hike
The irony is that this defensive bid is forming just as the monetary backdrop turns more hostile. A voting member of the Federal Open Market Committee (FOMC) said this week that he had scrapped his earlier call for a rate cut this year and now pencils in a hike instead, blaming inflation that runs broader than energy alone. That is a sharp hawkish turn barely a week after the Federal Reserve (Fed) held its policy rate in the 3.50% to 3.75% range in a unanimous vote, with the updated projections nudging the year-end median higher and quietly shelving the prior easing bias.
The data is starting to back the hawks: the Fed's preferred inflation gauge, the Personal Consumption Expenditures Price Index (PCE), ticked up again in May, while supply-side pressure from energy and the Strait of Hormuz keeps feeding the persistence story. Rate futures have answered by pricing out cuts altogether and handing a roughly one-in-four chance to a hike at the July meeting. The lone offset came from the day's University of Michigan survey, where the expectations gauge beat forecasts and five-year inflation expectations cooled to 3.3%, enough to blunt the hawkish edge and keep stocks bid.
A ceasefire the tape would rather not notice
Layered on top is a geopolitical wildcard the market is treating as background noise. President Trump used a Friday post on Truth Social to accuse Iran of breaking the ceasefire, claiming it fired at least four one-way attack drones at vessels crossing the Strait of Hormuz, with one striking a cargo ship before US forces downed the rest. For a channel that moves close to a fifth of the world's seaborne energy, that is no footnote.
The Dow can shrug it off for the same reason the rotation works: while the threat stays penned into energy and shipping, defensive sectors arguably benefit from the inflation it implies. The danger is the day this stops being a sector rotation and turns into broad de-risking, the kind where even safe-haven equities get sold because cash becomes the only haven left.
Levels to watch
Resistance: The immediate ceiling is the round 52,000 level the index is pressing against, with the record high around 52,300 the line bulls must clear to keep the uptrend intact. A daily close above it opens fresh ground with little overhead to fight.
Support: The first cushion is the 50-period Exponential Moving Average (EMA) near 50,400, which has shadowed the rally off the April low and sits just above the round 50,000 mark. A daily close beneath it puts the rotation thesis in doubt; the deeper line is the 200-period EMA around 48,300, in play only if the defensive bid gives way to genuine selling.
Bias: The lean is higher while the structure holds, but with one hand on the exit. The path of least resistance points to the record around 52,300 while the index holds the 50 EMA around 50,400, and with the Stochastic Relative Strength Index (Stoch RSI) mid-range rather than stretched, there is room for the grind. The call flips on a daily close back below 50,400, a signal that the safe-haven bid has run dry and the technology-led selling has gone broad, opening 50,000 and then the 200-period EMA close to 48,300. Rent this trend on momentum; do not marry it.
Dow Jones daily chart
Dow Jones FAQs
The Dow Jones Industrial Average, one of the oldest stock market indices in the world, is compiled of the 30 most traded stocks in the US. The index is price-weighted rather than weighted by capitalization. It is calculated by summing the prices of the constituent stocks and dividing them by a factor, currently 0.152. The index was founded by Charles Dow, who also founded the Wall Street Journal. In later years it has been criticized for not being broadly representative enough because it only tracks 30 conglomerates, unlike broader indices such as the S&P 500.
Many different factors drive the Dow Jones Industrial Average (DJIA). The aggregate performance of the component companies revealed in quarterly company earnings reports is the main one. US and global macroeconomic data also contributes as it impacts on investor sentiment. The level of interest rates, set by the Federal Reserve (Fed), also influences the DJIA as it affects the cost of credit, on which many corporations are heavily reliant. Therefore, inflation can be a major driver as well as other metrics which impact the Fed decisions.
Dow Theory is a method for identifying the primary trend of the stock market developed by Charles Dow. A key step is to compare the direction of the Dow Jones Industrial Average (DJIA) and the Dow Jones Transportation Average (DJTA) and only follow trends where both are moving in the same direction. Volume is a confirmatory criteria. The theory uses elements of peak and trough analysis. Dow’s theory posits three trend phases: accumulation, when smart money starts buying or selling; public participation, when the wider public joins in; and distribution, when the smart money exits.
There are a number of ways to trade the DJIA. One is to use ETFs which allow investors to trade the DJIA as a single security, rather than having to buy shares in all 30 constituent companies. A leading example is the SPDR Dow Jones Industrial Average ETF (DIA). DJIA futures contracts enable traders to speculate on the future value of the index and Options provide the right, but not the obligation, to buy or sell the index at a predetermined price in the future. Mutual funds enable investors to buy a share of a diversified portfolio of DJIA stocks thus providing exposure to the overall index.
Recommended Articles


Comments (0)
Click the $ button, enter the symbol, and select to link a stock, ETF, or other ticker.