

USD/CHF Price Forecast: Bulls remain in charge with 0.7850 capping losses

- USD/CHF hesitates near two-week highs with 0.7850 holding bears.
- Hopes about progress in the US-Iran peace process have lifted market sentiment on Monday.
- The pair maintains its bullish trend intact after breaking above a descending wedge.
The US Dollar (USD) hesitates against the Swiss Franc (CHF) on Monday after rallying nearly 1.2% in the four previous trading days. The pair, however, maintains its bullish tone intact with dips contained above 0.7850 and two-week highs, at 0.7877, at a short distance.
A spokesperson from the Iranian Foreign Ministry eased risk aversion earlier on Monday, affirming on local media that peace negotiations between Washington and Tehran are going on and flagging the reopening of the Strait of Hormuz. These comments weighed on the US Dollar’s rally, although investors remain cautious.
Technical Analysis: USD/CHF breaks above the descending wedge pattern
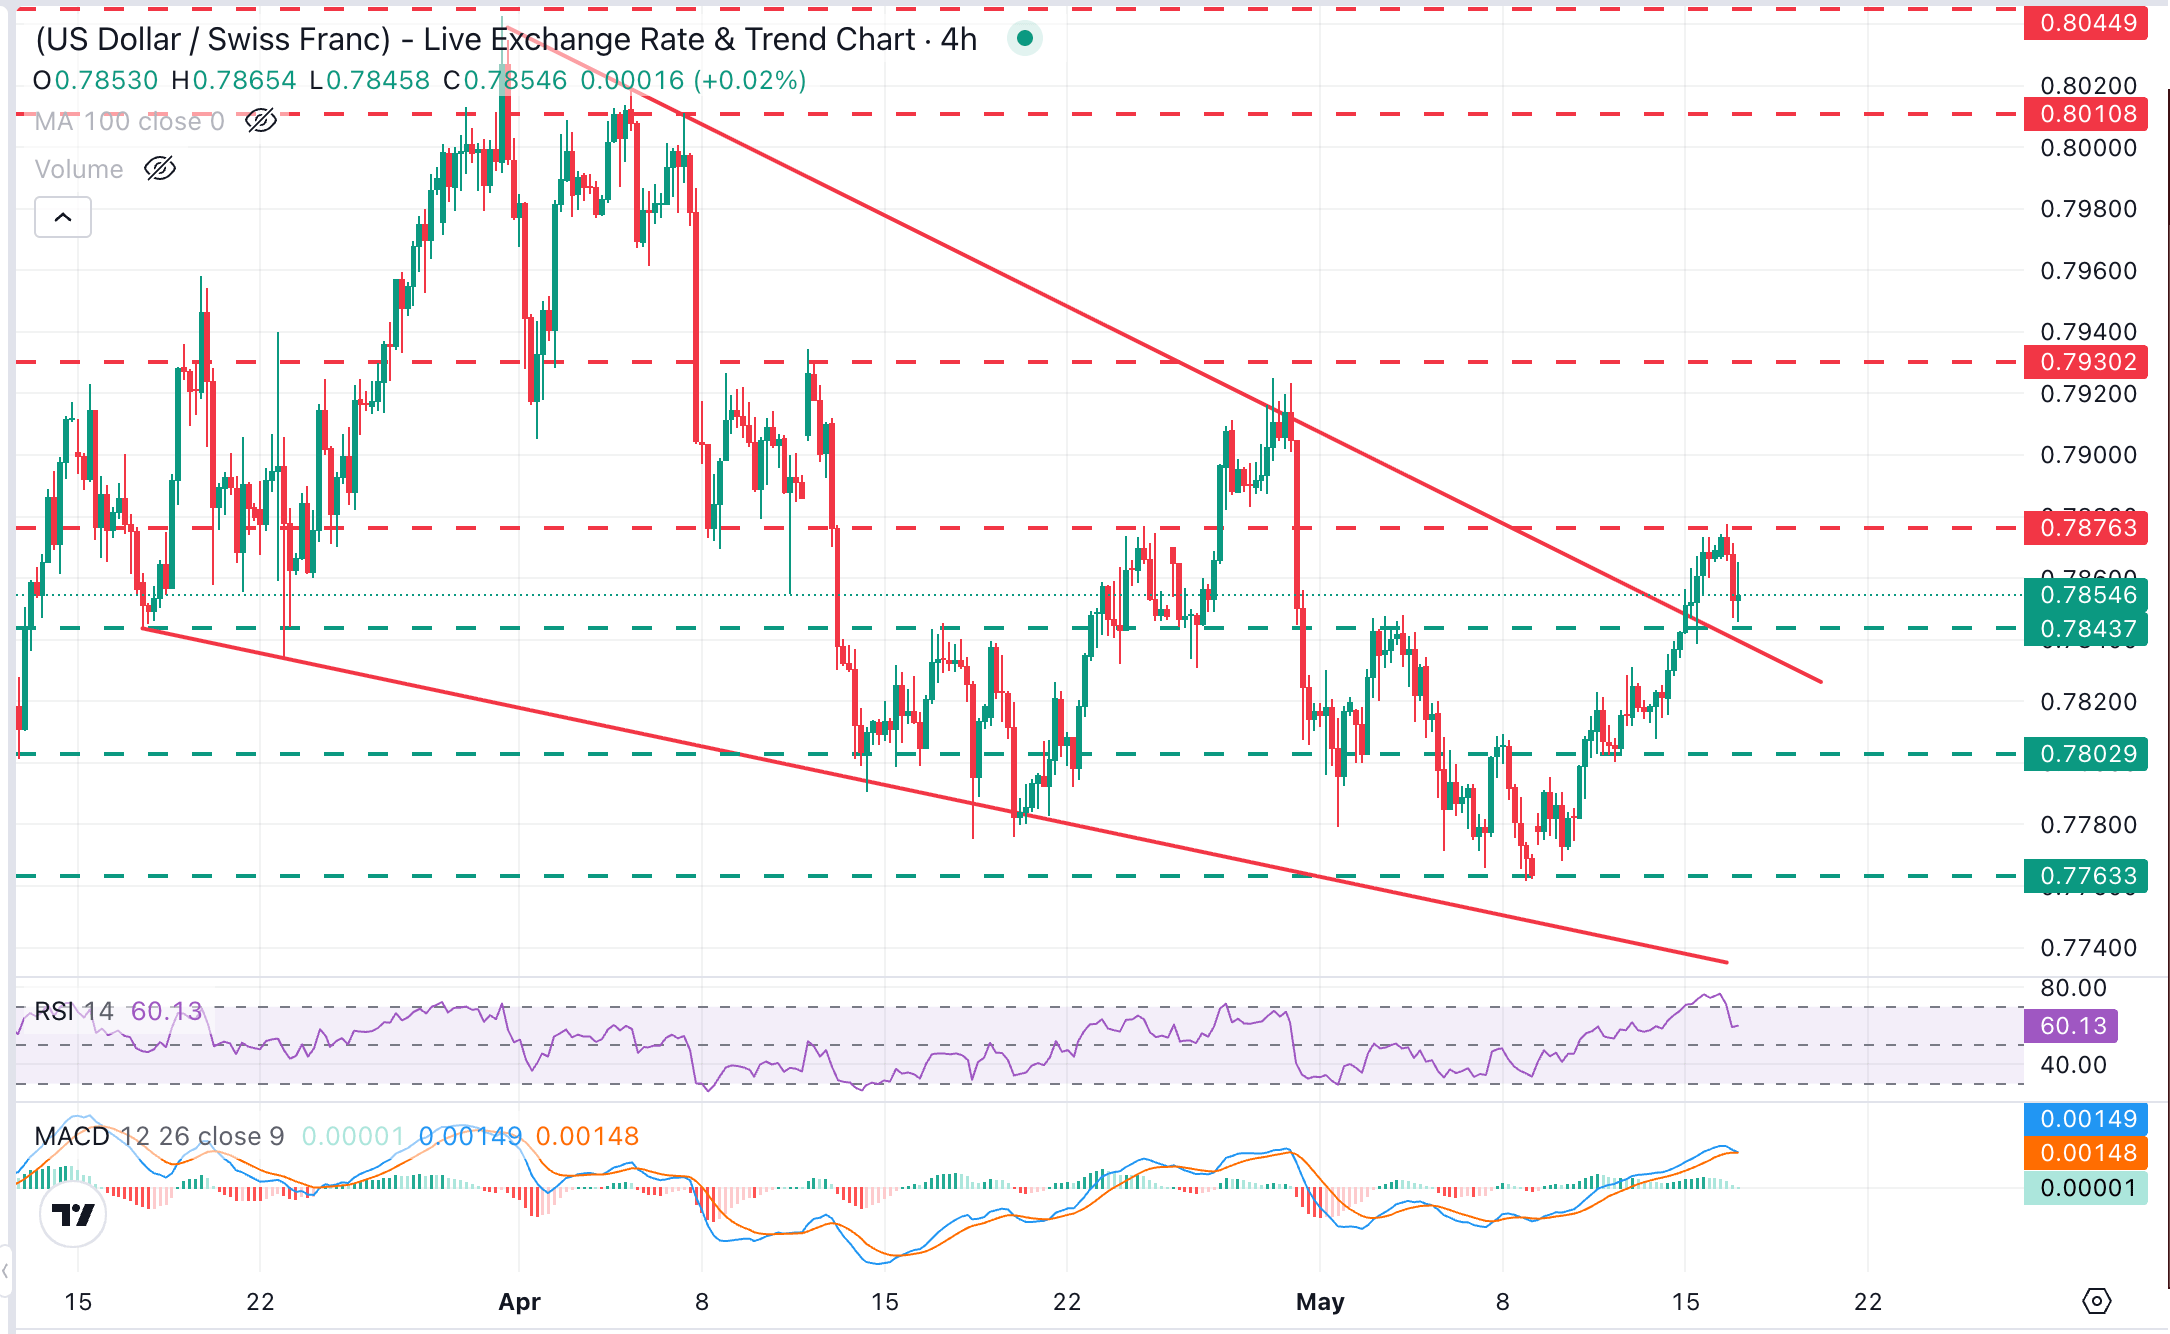
USD/CHF maintains a constructive near-term tone, standing above the top of a descending wedge pattern, a figure that often anticipates a bullish outcome. The Relative Strength Index (RSI) on the 4-hour chart is around 60 after pulling back from overbought territory, while the Moving Average Convergence Divergence (MACD) histogram shows a moderate positive momentum.
Downside attempts remain capped above the confluence of early May highs, at the 0.7845 area and the reverse trendline, now at the 0.7835 area. A clear break below those levels negates the bullish bias and brings the May 13 and 14 lows, near 0.7800, back to the focus.
On the topside, initial resistance emerges at the 0.7877 intraday highs. Further up, the next target is at the April 13 and 29 highs, in the 0.7925-0.7930 area.
(The technical analysis of this story was written with the help of an AI tool.)
US Dollar Price Today
The table below shows the percentage change of US Dollar (USD) against listed major currencies today. US Dollar was the strongest against the Japanese Yen.
| USD | EUR | GBP | JPY | CAD | AUD | NZD | CHF | |
|---|---|---|---|---|---|---|---|---|
| USD | -0.16% | -0.36% | 0.03% | -0.02% | -0.12% | -0.36% | -0.19% | |
| EUR | 0.16% | -0.22% | 0.18% | 0.13% | 0.00% | -0.21% | -0.05% | |
| GBP | 0.36% | 0.22% | 0.40% | 0.34% | 0.23% | 0.00% | 0.17% | |
| JPY | -0.03% | -0.18% | -0.40% | -0.10% | -0.18% | -0.44% | -0.25% | |
| CAD | 0.02% | -0.13% | -0.34% | 0.10% | -0.09% | -0.33% | -0.16% | |
| AUD | 0.12% | -0.01% | -0.23% | 0.18% | 0.09% | -0.22% | -0.04% | |
| NZD | 0.36% | 0.21% | -0.00% | 0.44% | 0.33% | 0.22% | 0.18% | |
| CHF | 0.19% | 0.05% | -0.17% | 0.25% | 0.16% | 0.04% | -0.18% |
The heat map shows percentage changes of major currencies against each other. The base currency is picked from the left column, while the quote currency is picked from the top row. For example, if you pick the US Dollar from the left column and move along the horizontal line to the Japanese Yen, the percentage change displayed in the box will represent USD (base)/JPY (quote).
Recommended Articles


Comments (0)
Click the $ button, enter the symbol, and select to link a stock, ETF, or other ticker.