

Pound Sterling trades lower against US Dollar ahead of US CPI data

- The Pound Sterling falls to near 1.3515 against the US Dollar ahead of the US CPI data for August.
- The US inflation data will influence market speculation for the size of the Fed’s interest rate cut next week.
- Investors await UK GDP and factory data for July, scheduled for Friday.
The Pound Sterling (GBP) drops to near 1.3510 against the US Dollar (USD) during the European trading session on Thursday. The GBP/USD pair is expected to trade cautiously ahead of the United States (US) Consumer Price Index (CPI) data for August, which will be published at 12:30 GMT.
The US Dollar Index (DXY), which tracks the Greenback’s value against six major currencies, trades near a three-day high around 98.00 at the time of writing.
As the CME FedWatch tool shows that traders are confident about the Federal Reserve (Fed) resuming its monetary-easing campaign in the policy meeting next week, investors will monitor the US inflation data to get cues about the likely size of the interest rate cut.
Traders see an 8% chance that the central bank will cut interest rates by 50 basis points (bps) to 3.75%-4.00% on September 17, while the rest point a standard 25-bps interest rate reduction, according to the CME FedWatch tool.
As measured by the CPI, the US headline inflation is expected to have grown at an annualized pace of 2.9%, faster than 2.7% seen in July. The core CPI – which excludes volatile food and energy items – is estimated to have risen steadily by 3.1% YoY. Month-on-month headline and the core CPI are expected to have grown by 0.3%.
Signs of price pressures cooling would prompt traders to raise bets supporting a bigger interest rate reduction by the Fed in next week’s policy meeting. On the contrary, hot inflation figures would weaken the same.
Daily digest market movers: Investors await key UK monthly GDP data
- The Pound Sterling trades broadly stable against its main currency peers on Thursday. The British currency has performed better against its major peers over the past few trading sessions, with traders anticipating a policy divergence between the Bank of England (BoE) and other central banks from Europe and North America.
- The BoE is unlikely to cut interest rates in the near term as stubborn inflationary pressures in the United Kingdom (UK) economy have remained a key drag on the central bank’s dovish speculation. The UK headline CPI rose at an annualized pace of 3.8% in July, the highest level seen since February 2024.
- In the hearing before the House of Commons’ Treasury Committee last week, BoE Deputy Governor Clare Lombardelli delivered a hawkish guidance on the interest rate outlook, citing upside inflation risks. Lombardelli warned that further monetary policy expansion could derail the central bank’s goal of bringing inflation sustainably down to the 2% target.
- In Thursday's session, the European Central Bank (ECB) is expected to hold its Deposit Rate steady at 2% and might leave the door open for further interest rate cuts. This would be the second straight meeting where ECB officials will keep their borrowing rates steady.
- Going forward, investors will focus on the UK Gross Domestic Product (GDP) and the factory data for July, which are scheduled for Friday. The Office for National Statistics (ONS) is expected to show that the economic growth remained stagnant on a monthly basis. In June, the UK economy expanded by 0.4%.
- On the fiscal front, a report from Reuters has shown that UK Chancellor of the Exchequer Rachel Reeves has committed to exploring pro-growth tax reforms to support small businesses. New tax reforms by the UK government to boost domestic growth could force it to compromise with its own-defined fiscal rules, a move that could boost UK gilt yields, knowing that the economy is already facing ballooning fiscal debt risks.
Technical Analysis: Pound Sterling trades inside Ascending Triangle pattern
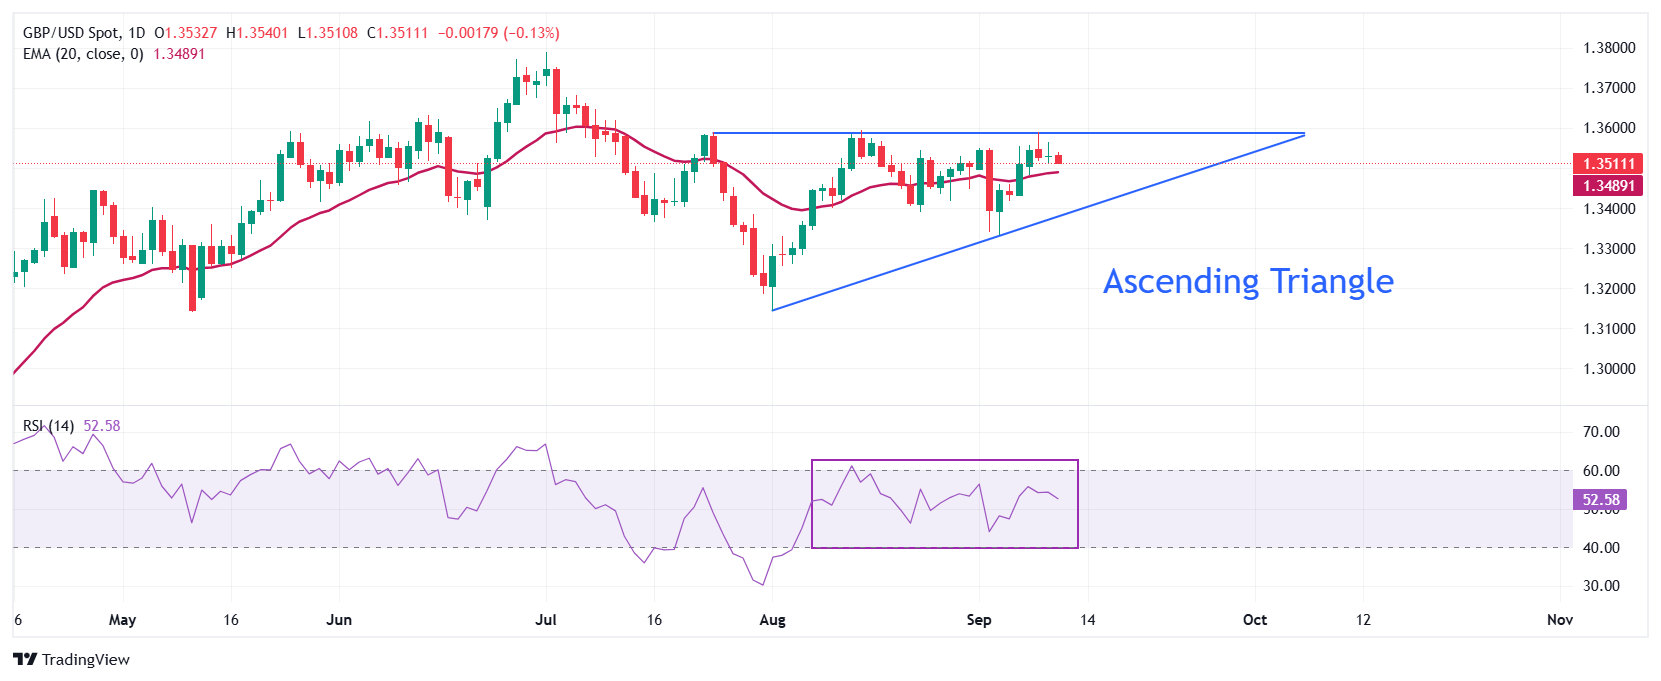
The Pound Sterling edges lower to near 1.3515 against the US Dollar (USD) on Thursday. The GBP/USD pair trades inside the Ascending Triangle chart pattern, which indicates indecisiveness among investors. The horizontal resistance of the above-mentioned chart pattern is plotted from the July 23 high around 1.3585, while the upward-sloping border is placed from the August 1 low near 1.3140.
The near-term trend of the Cable remains sideways as it trades close to the 20-day Exponential Moving Average (EMA), which is around 1.3489.
The 14-day Relative Strength Index (RSI) oscillates inside the 40.00-60.00 range, indicating a sideways trend.
Looking down, the August 1 low of 1.3140 will act as a key support zone. On the upside, the July 1 high near 1.3800 will act as a key barrier.
Economic Indicator
Consumer Price Index (YoY)
Inflationary or deflationary tendencies are measured by periodically summing the prices of a basket of representative goods and services and presenting the data as The Consumer Price Index (CPI). CPI data is compiled on a monthly basis and released by the US Department of Labor Statistics. The YoY reading compares the prices of goods in the reference month to the same month a year earlier.The CPI is a key indicator to measure inflation and changes in purchasing trends. Generally speaking, a high reading is seen as bullish for the US Dollar (USD), while a low reading is seen as bearish.
Next release: Thu Sep 11, 2025 12:30
Frequency: Monthly
Consensus: 2.9%
Previous: 2.7%
Source: US Bureau of Labor Statistics
The US Federal Reserve (Fed) has a dual mandate of maintaining price stability and maximum employment. According to such mandate, inflation should be at around 2% YoY and has become the weakest pillar of the central bank’s directive ever since the world suffered a pandemic, which extends to these days. Price pressures keep rising amid supply-chain issues and bottlenecks, with the Consumer Price Index (CPI) hanging at multi-decade highs. The Fed has already taken measures to tame inflation and is expected to maintain an aggressive stance in the foreseeable future.
Recommended Articles


Comments (0)
Click the $ button, enter the symbol, and select to link a stock, ETF, or other ticker.