

Australian Dollar remains subdued following China’s CPI data

- Australian Dollar remains silent after the China Consumer Price Index data was released on Wednesday.
- China’s CPI declined 0.4% YoY, while inflation came in at 0% in August.
- US Nonfarm Payrolls Benchmark Revision suggested that total Nonfarm employment for March 2025 will likely be revised down by 911,000.
The Australian Dollar (AUD) loses ground on Wednesday for the second consecutive day. The AUD/USD pair struggles as the US Dollar (USD) extends its gains despite the United States (US) Nonfarm Payrolls Benchmark Revision, which has boosted odds that the Federal Reserve (Fed) will begin cutting interest rates as soon as next week.
The AUD/USD pair holds losses following the release of China’s Consumer Price Index (CPI), which declined 0.4% year-over-year in August after arriving at 0% in July. The market consensus was for a 0.2% decline in the reported period. The monthly CPI inflation came in at 0% versus the previous 0.4% and the expected 0.1% increase.
The AUD may limit its downside as a solid July Trade Surplus, along with Q2 GDP figures and hotter July inflation, dampen expectations of additional Reserve Bank of Australia (RBA) rate cuts. Swaps are now assigning nearly an 84% probability that the RBA will keep policy unchanged in September, while the likelihood of a 25-basis-point rate cut in November has eased to 80% from 100%.
However, Matthew Hassan, Head of Australian Macro-Forecasting, noted that consumer recovery since mid-2024 has been sluggish, following a decline in Westpac Consumer Confidence to 95.4 in September from 98.5 in August. Hassan indicated that further policy easing may be required, projecting a 25-basis-point RBA rate cut in November, followed by two additional reductions in 2026.
Focus will shift toward US inflation reports that could provide more cues on Fed policy outlook. The August US Producer Price Index (PPI) is scheduled for release on Wednesday, followed by the Consumer Price Index (CPI) on Thursday.
Australian Dollar depreciates as US Dollar advances despite rising odds of Fed rate cuts
- The US Dollar Index (DXY), which measures the value of the US Dollar against six major currencies, is gaining ground and trading around 97.90 at the time of writing. However, the upside of the Greenback could be limited as traders now widely expect a rate cut in September, marking a restart to the Fed's easing cycle. The CME FedWatch tool indicates a pricing in more than 93% of a 25-basis-point (bps) rate cut by the Fed at the September policy meeting, up from 86% a week ago.
- The US Bureau of Labor Statistics (BLS) reported on Tuesday that the preliminary estimate of the Current Employment Statistics (CES) national benchmark revision suggests total Nonfarm employment for March 2025 will likely be revised down by 911,000, or about 76,000 fewer jobs per month, signaling a weaker labor market than previously estimated. The final benchmark revision will be issued in February 2026 with the publication of the January 2026 Employment Situation news release," the BLS noted in its press release.
- Federal Reserve (Fed) Bank of Chicago President Austan Goolsbee said in an interview on Bloomberg TV on Friday that he is still unsure whether September is the right time for an interest rate cut, following weaker jobs data. He added that high inflation data is still cause for concern, and key Fed officials may not be fully sold on a September rate cut.
- The US Bureau of Labor Statistics (BLS) reported on Friday that the US Nonfarm Payrolls (NFP) rose by 22,000 in August, falling short of the market expectations of 75,000. This figure followed the 79,000 increase (revised from 73,000) recorded in July. Meanwhile, the Unemployment Rate increased to 4.3% in August, as expected, against the 4.2% prior. Average Hourly Earnings increased 0.3% MoM in August, in line with expectations.
- China’s Trade Balance rose to CNY 732.7 billion in August, up from CNY 705.18 billion previously. Exports rose 4.8% YoY in August vs. 8% in July. The country’s imports advanced 1.7% YoY in the same period vs. 4.8% recorded previously.
- Australia’s Trade Balance increased to 7,310 million month-over-month in July, from 5,366 million the prior month. The trade surplus widened against the expected decline to 4,920 million. Gross Domestic Product (GDP) rose by 0.6% quarter-over-quarter in Q2, following the 0.3% growth in Q1 and surpassing the expectations of 0.5% expansion. Meanwhile, the annual Q2 GDP grew by 1.8%, compared with the 1.4% growth in Q1, and was above the consensus of a 1.6% increase.
- Australia’s Monthly Consumer Price Index rose 2.8% year-over-year in July, beating both the previous 1.9% increase and the 2.3% forecast.
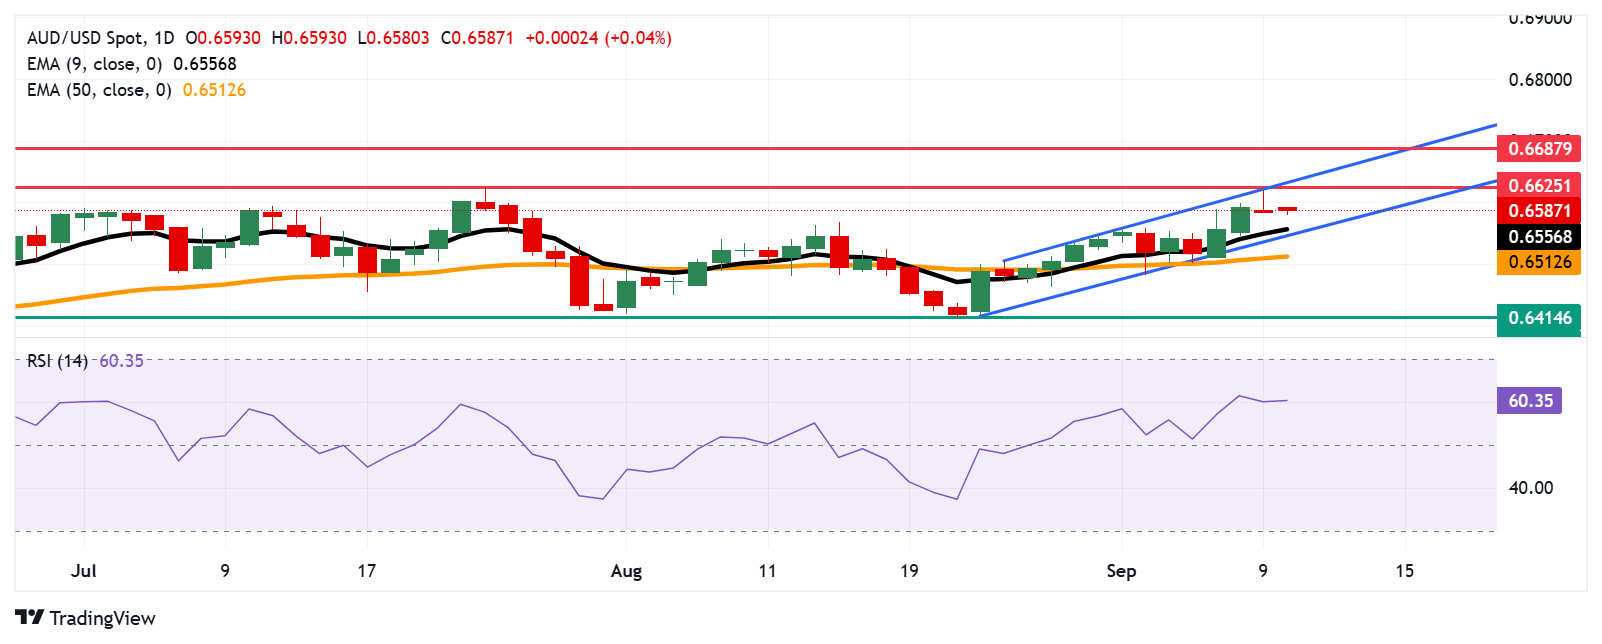
Australian Dollar pulls back from the confluence zone around 0.6600 barrier
The AUD/USD pair is trading around 0.6580 on Wednesday. The technical analysis of the daily chart shows the pair remains within the ascending channel pattern, suggesting a persistent bullish bias. Additionally, the pair lies above the nine-day Exponential Moving Average (EMA), indicating short-term price momentum is stronger.
The initial resistance lies at the 10-month high of 0.6625, which was recorded on July 24, followed by the upper boundary of the ascending channel at around 0.6640. A break above this crucial resistance zone would strengthen the bullish bias and support the AUD/USD pair to a move toward the 11-month high of 0.6687, recorded in November 2024.
On the downside, the AUD/USD pair may target the nine-day EMA of 0.6556, aligned with the ascending channel’s lower boundary around 0.6550. A break below the channel would weaken the bullish bias and prompt the pair to test the 50-day EMA at 0.6512. Further declines would dampen the medium-term price momentum and put downward pressure on the pair to navigate the region around the three-month low of 0.6414, recorded on August 21.
AUD/USD: Daily Chart
Australian Dollar Price Today
The table below shows the percentage change of Australian Dollar (AUD) against listed major currencies today. Australian Dollar was the weakest against the US Dollar.
| USD | EUR | GBP | JPY | CAD | AUD | NZD | CHF | |
|---|---|---|---|---|---|---|---|---|
| USD | 0.10% | 0.02% | 0.09% | 0.07% | 0.09% | 0.05% | 0.04% | |
| EUR | -0.10% | -0.07% | -0.10% | -0.03% | -0.06% | -0.06% | -0.05% | |
| GBP | -0.02% | 0.07% | 0.02% | 0.05% | 0.03% | 0.02% | 0.05% | |
| JPY | -0.09% | 0.10% | -0.02% | 0.08% | -0.04% | -0.03% | 0.27% | |
| CAD | -0.07% | 0.03% | -0.05% | -0.08% | -0.04% | -0.06% | 0.00% | |
| AUD | -0.09% | 0.06% | -0.03% | 0.04% | 0.04% | -0.00% | 0.03% | |
| NZD | -0.05% | 0.06% | -0.02% | 0.03% | 0.06% | 0.00% | 0.19% | |
| CHF | -0.04% | 0.05% | -0.05% | -0.27% | -0.00% | -0.03% | -0.19% |
The heat map shows percentage changes of major currencies against each other. The base currency is picked from the left column, while the quote currency is picked from the top row. For example, if you pick the Australian Dollar from the left column and move along the horizontal line to the US Dollar, the percentage change displayed in the box will represent AUD (base)/USD (quote).
Economic Indicator
Consumer Price Index (YoY)
The Consumer Price Index (CPI), released by the National Bureau of Statistics of China on a monthly basis, measures changes in the price level of consumer goods and services purchased by residents. The CPI is a key indicator to measure inflation and changes in purchasing trends. The YoY reading compares prices in the reference month to the same month a year earlier. Generally, a high reading is seen as bullish for the Renminbi (CNY), while a low reading is seen as bearish.
Last release: Wed Sep 10, 2025 01:30
Frequency: Monthly
Actual: -0.4%
Consensus: -0.2%
Previous: 0%
Source: National Bureau of Statistics of China
Recommended Articles


Comments (0)
Click the $ button, enter the symbol, and select to link a stock, ETF, or other ticker.