

Australian Dollar remains steady following TD-MI Inflation Gauge data

- The Australian Dollar holds ground as TD-MI Inflation Gauge climbed 0.9% MoM in July.
- The AUD found support after Australia was excluded from the latest round of US tariff increases.
- A weaker US jobs data led markets to price in two interest rate cuts by the Fed.
The Australian Dollar (AUD) advances against the US Dollar (USD) on Monday, extending its gains for the second successive trading day. The AUD/USD pair gained ground following the release of Australia's inflation gauge data.
TD-MI Inflation Gauge rose 0.9% month-over-month in July, following June’s modest 0.1% rise and marking the sharpest rise since December 2023. Meanwhile, the annual inflation gauge remained consistent at a 2.4% increase. The monthly increase adds to the Reserve Bank of Australia's (RBA) concerns amid continued uncertainty in supply chains and consumer demand.
The AUD also received support as Australia was spared from the latest United States (US) tariff hikes, indicating that President Donald Trump had left the 10% baseline tariffs on Australian goods unchanged. Moreover, a weaker United States (US) jobs report prompted market reaction to price in two interest rate cuts by the Federal Reserve (Fed).
The US and China were unable to reach an agreement on extending the 90-day tariff pause during their latest round of talks in Stockholm, Sweden. The current pause is set to expire on August 12, with the final decision resting in the hands of US President Donald Trump. In the meantime, US tariffs have been lowered from 145% to 30%, while Chinese tariffs have been reduced from 125% to 10%.
Australian Dollar steadies despite a stable US Dollar amid uncertain Fed outlook
- The US Dollar Index (DXY), which measures the value of the US Dollar against six major currencies, is rebounding from a sharp decline in the previous session and trading around 98.70 at the time of writing.
- Nonfarm Payrolls (NFP) in the United States (US) rose by 73,000 in July, compared to a 14,000 increase (revised from 147,000) seen in June. This figure came in weaker than the market expectation of 110,000. Additionally, the Unemployment Rate ticked higher to 4.2% in July from 4.1% in June, as expected.
- President Trump signed an executive order on Thursday, imposing tariffs ranging from 10% to 41%, set to go into effect on August 1, on US imports from dozens of countries and foreign locations, including Canada, India, and Taiwan, that failed to reach the trade deals deadline, per Reuters.
- Core US Personal Consumption Expenditure Price Index (PCE) inflation ticked higher in June, rising 0.3% MoM as many market participants had expected. On an annualized basis, PCE inflation accelerated to 2.6% YoY, outrunning the expected hold at 2.5%.
- The Federal Reserve (Fed) decided to hold its benchmark federal funds rate in a range of 4.25%-4.5% at its July meeting on Wednesday, as widely expected. Fed Chair Jerome Powell said in a post-policy conference that the US central bank has "made no decisions" about a potential policy change in September, and it may take a bit to assess the effect of tariffs on consumer prices.
- US President Donald Trump announced a new trade deal with South Korea, imposing a 15% US tariff on imports from South Korea. The agreement also includes a $350 billion commitment from South Korea toward US-owned and controlled investments, Reuters reported on Wednesday.
- The United States and European Union reached a framework trade agreement on Sunday that sets 15% tariffs on most European goods, taking effect on August 1. This deal has ended a months-long stand-off, per Bloomberg.
- US Treasury Secretary Scott Bessent said during an interview on CNBC’s “Squawk Box” on Thursday, expressing confidence that the US and China may reach a trade deal as a key tariff deadline nears. Bessent said, “I believe that we have the makings of a deal.” “There are still a few technical details to be worked out on the Chinese side between us. I’m confident that it will be done, but it’s not 100% done,” he added.
- China’s Finance Minister Lan Fo’an said on Tuesday that the country will ramp up fiscal support to bolster domestic consumption and mitigate mounting economic headwinds. He emphasized that uncertainty around China’s development environment is growing and Beijing will adopt more proactive fiscal policies to help stabilise growth.
- Australia’s Trade Minister Don Farrell stated on Friday that the White House had confirmed no country enjoys lower reciprocal tariffs than Australia. He added that this gives Australian products a competitive edge in the US market, potentially boosting exports. “We will support all our exporters in taking full advantage of this opportunity to increase export volumes,” Farrell said.
- Australia’s Producer Price Index (PPI) rose by 0.7% quarter-over-quarter in the second quarter, against the expected and previous increase of 0.9%. The annual PPI climbed 3.4% in Q2 versus 3.7% prior. Meanwhile, China’s Caixin Manufacturing Purchasing Managers Index (PMI) eased to 49.5 in July from 50.4 in June. This figure came in below the market forecast of 50.3.
Australian Dollar remains above 0.6450 despite a bearish bias
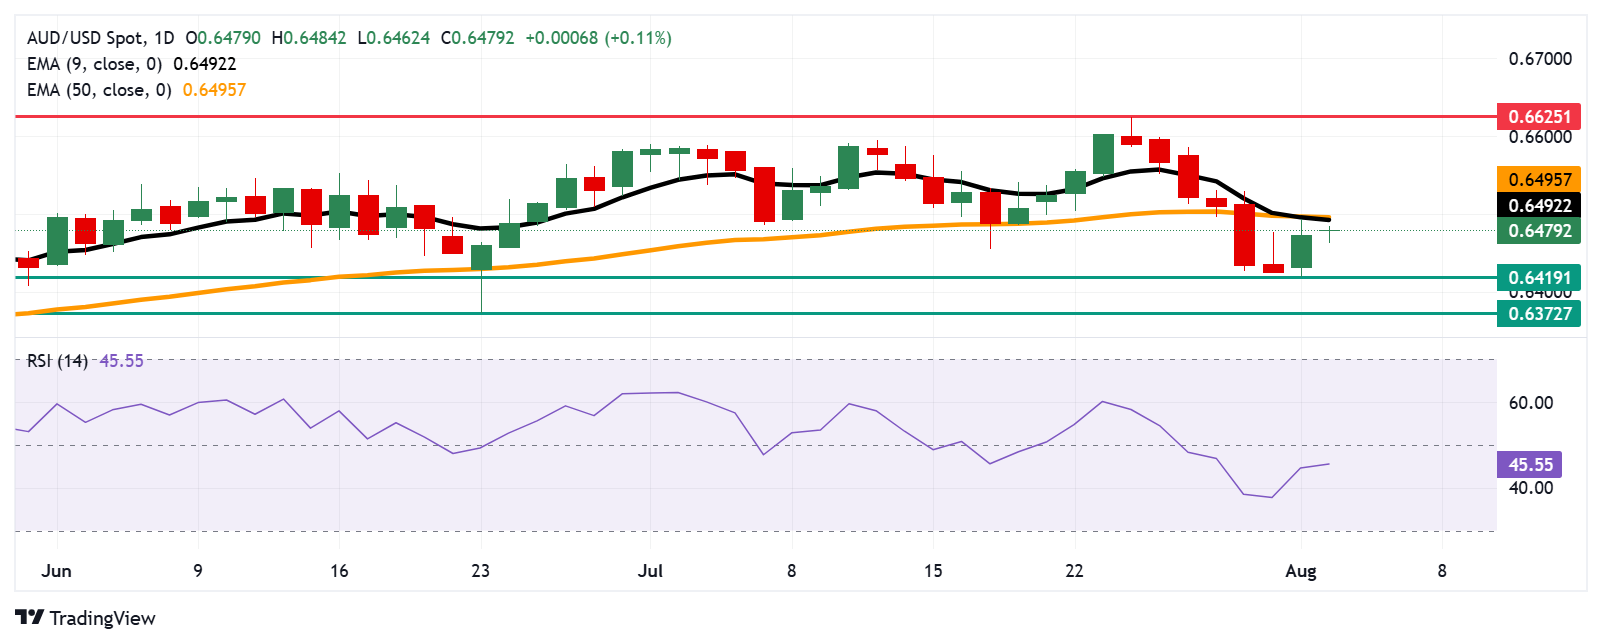
The AUD/USD pair is trading around 0.6480 on Monday. Technical analysis on the daily chart suggests a bearish bias, with the 14-day Relative Strength Index (RSI) holding below the 50 level. The pair is also positioned below the nine-day Exponential Moving Average (EMA), signaling weakening short-term momentum.
On the downside, the AUD/USD pair could find the primary support at the two-month low of 0.6419, which was recorded on August 1. A break below this level could put downward pressure on the pair to test a three-month low at 0.6372, recorded on June 23.
The AUD/USD pair may target the initial barrier at the nine-day EMA of 0.6492, aligned with the 50-day EMA of 0.6495. A break above these levels could strengthen the short- and medium-term price momentum and support the pair to explore the region around the nine-month high at 0.6625.
AUD/USD: Daily Chart
Australian Dollar PRICE Today
The table below shows the percentage change of Australian Dollar (AUD) against listed major currencies today. Australian Dollar was the strongest against the Japanese Yen.
| USD | EUR | GBP | JPY | CAD | AUD | NZD | CHF | |
|---|---|---|---|---|---|---|---|---|
| USD | 0.15% | 0.02% | 0.33% | -0.04% | 0.01% | -0.09% | -0.03% | |
| EUR | -0.15% | -0.07% | 0.19% | -0.17% | -0.27% | -0.24% | -0.19% | |
| GBP | -0.02% | 0.07% | 0.27% | -0.10% | -0.19% | -0.17% | -0.12% | |
| JPY | -0.33% | -0.19% | -0.27% | -0.35% | -0.46% | -0.42% | -0.19% | |
| CAD | 0.04% | 0.17% | 0.10% | 0.35% | -0.11% | -0.06% | -0.02% | |
| AUD | -0.01% | 0.27% | 0.19% | 0.46% | 0.11% | 0.02% | 0.08% | |
| NZD | 0.09% | 0.24% | 0.17% | 0.42% | 0.06% | -0.02% | 0.04% | |
| CHF | 0.03% | 0.19% | 0.12% | 0.19% | 0.02% | -0.08% | -0.04% |
The heat map shows percentage changes of major currencies against each other. The base currency is picked from the left column, while the quote currency is picked from the top row. For example, if you pick the Australian Dollar from the left column and move along the horizontal line to the US Dollar, the percentage change displayed in the box will represent AUD (base)/USD (quote).
Economic Indicator
TD-MI Inflation Gauge (MoM)
The TD-MI inflation gauge, released by Melbourne Institute, is designed to provide a timely and accurate monthly measure of inflation in Australia. Based on the Australian Bureau of Statistics methodology for calculating the quarterly consumer price index, the Melbourne Institute Monthly Inflation Gauge estimates month-to-month price movements for a wide-ranging basket of goods and services across the main capital cities of Australia. The MoM figure compares the prices of goods in the reference month to the previous month. The higher the inflation, the stronger the effect it will have on the probability of an interest-rate hike by the RBA. Generally speaking, a high reading should be taken as positive, or bullish, for the AUD, while a low reading is seen as negative or bearish.
Last release: Mon Aug 04, 2025 01:00
Frequency: Monthly
Actual: 0.9%
Consensus: -
Previous: 0.1%
Source: Melbourne Institute
Recommended Articles


Comments (0)
Click the $ button, enter the symbol, and select to link a stock, ETF, or other ticker.