

When is the US ISM Services PMI data for March and how could it affect EUR/USD?

US ISM Services PMI Preview
The United States (US) Institute of Supply Management (ISM) Services Purchasing Managers’ Index (PMI) data for March is scheduled to be published today at 14:00 GMT.
The ISM report is expected to show that the service sector activity expanded again, but at a moderate pace. The Services PMI is estimated to arrive at 55.0, lower than 56.1 in February. Investors will pay close attention to the Services PMI data as the related sector accounts for two-thirds of the US economy.
Apart from the Services PMI, investors will also focus on sub-components of data, such as Employment Index, New Orders Index, and Prices Paid.
Theoretically, weaker-than-projected US ISM Services PMI data boost dovish Federal Reserve (Fed) expectations in the near term. However, upbeat figures would do the opposite.
How could US ISM Services PMI data affect EUR/USD?
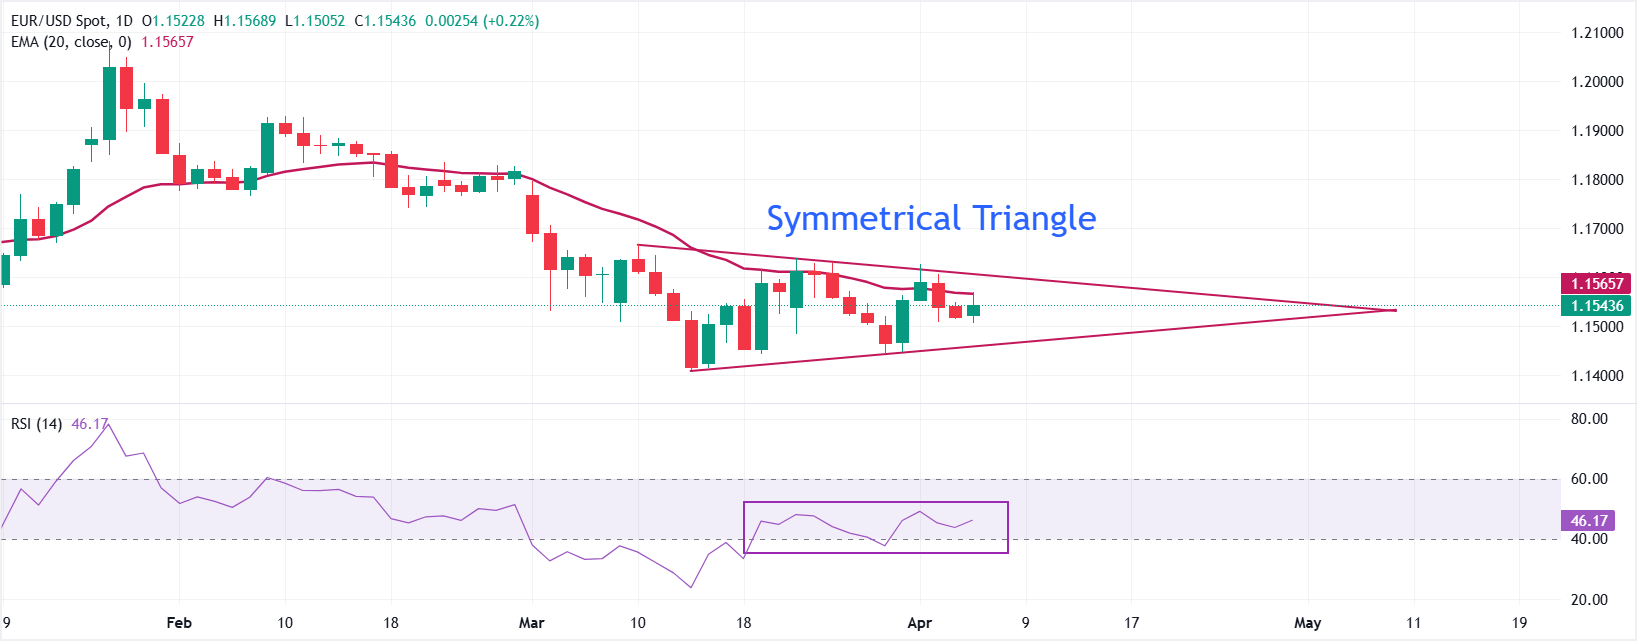
EUR/USD trades 0.25% at around 1.1544 during the late European trading session on Monday. In the daily chart, price holds between a descending resistance trend line from 1.1666 and an ascending support line from 1.1408, keeping the near-term bias neutral with a slight downside tilt as the pair trades just below the 20-day Exponential Moving Average (EMA) near 1.1566.
The 14-day Relative Strength Index (RSI) stays inside the 40.00-60.00 range, reflecting a contracting structure, which is typically followed by a volatility expansion.
Immediate resistance emerges at the 20-day EMA around 1.1566, with the descending trend line reinforcing a cap near 1.1600; a daily close above this zone would open the way toward the March 10 high at 1.1667. On the downside, initial support aligns with the rising trend line near 1.1500, and a break through this level would expose the price towards the March low at 1.1411.
(The technical analysis of this story was written with the help of an AI tool.)
Economic Indicator
ISM Services PMI
The Institute for Supply Management (ISM) Services Purchasing Managers Index (PMI), released on a monthly basis, is a leading indicator gauging business activity in the US services sector, which makes up most of the economy. The indicator is obtained from a survey of supply executives across the US based on information they have collected within their respective organizations. Survey responses reflect the change, if any, in the current month compared to the previous month. A reading above 50 indicates that the services economy is generally expanding, a bullish sign for the US Dollar (USD). A reading below 50 signals that services sector activity is generally declining, which is seen as bearish for USD.
Next release: Mon Apr 06, 2026 14:00
Frequency: Monthly
Consensus: 55
Previous: 56.1
Source: Institute for Supply Management
The Institute for Supply Management’s (ISM) Services Purchasing Managers Index (PMI) reveals the current conditions in the US service sector, which has historically been a large GDP contributor. A print above 50 shows expansion in the service sector’s economic activity. Stronger-than-expected readings usually help the USD gather strength against its rivals. In addition to the headline PMI, the Employment Index and the Prices Paid Index numbers are also watched closely by investors as they provide useful insights regarding the state of the labour market and inflation.
Recommended Articles


Comments (0)
Click the $ button, enter the symbol, and select to link a stock, ETF, or other ticker.