Australian Dollar inches higher after stronger Trade Balance data

- The Australian Dollar advances after the release of domestic trade balance data on Thursday.
- Australia’s Trade Surplus widened to 5,365 million MoM in June, against the expected 3,250 million.
- Trump warned that he may impose additional tariffs on China over its purchases of Russian Oil.
The Australian Dollar (AUD) edges higher against the US Dollar (USD) on Thursday, following a 0.5% gain in the previous session. The AUD/USD pair gains ground following the release of trade balance data.
The Australian Bureau of Statistics (ABS) reported that Australia’s Trade Surplus increased to 5,365 million month-over-month in June, surpassing the expected 3,250 million and the previous 1,604 million (revised from 2,238 million). The monthly Exports rose by 6.0% in June, while Imports fell by 3.1%.
US President Donald Trump warned China, Australia’s close trading partner, that he could impose further tariffs similar to the 25% levies announced earlier on India over its Russian Oil purchases, depending on what happens, per Reuters.
The Reserve Bank of Australia (RBA) is widely anticipated to deliver a 25 basis point rate cut next week, which would bring the cash rate down to 3.60%. The case for easing has grown stronger as core inflation slowed to 2.7% in June, well within the RBA’s 2–3% target, along with rising unemployment and slowing wage growth.
Australian Dollar advances as US Dollar trims recent gains
- The US Dollar Index (DXY), which measures the value of the US Dollar against six major currencies, is appreciating and trading around 98.30 at the time of writing. The US weekly Initial Jobless Claims will likely be eyed later on Thursday.
- US President Donald Trump announced on Tuesday that he will appoint the Fed’s Chair and Kugler’s replacement by the end of the week, and confirmed his choices for Chairman, including White House economic adviser Kevin Hassett, former Fed governor Kevin Warsh, and two other people. Trump also confirmed that Treasury Secretary Scott Bessent is not his choice for the Fed’s Chair.
- The Institute for Supply Management (ISM) Services PMI declined to 50.1 in July, down from 50.8 in the previous month and falling short of the expected reading of 51.5. Meanwhile, the ISM Services Prices Paid advanced to 69.9 from 67.5, the Employment Index ticked lower to 46.4 from 47.2, and the New Orders Index deflated to 50.3 from 51.3.
- The US Federal Reserve (Fed) is expected to deliver a 25 basis point rate cut in September, following weaker labor market data that has heightened concerns over the US economic outlook.
- The US and China were unable to reach an agreement on extending the 90-day tariff pause during their latest round of talks in Stockholm, Sweden. The current pause is set to expire on August 12, with the final decision resting in the hands of US President Donald Trump. In the meantime, US tariffs have been lowered from 145% to 30%, while Chinese tariffs have been reduced from 125% to 10%.
- China's Caixin Services Purchasing Managers' Index unexpectedly jumped to 52.6 in July from 50.6 in June. The market forecast was for a 50.2 print in the reported period.
- Australia’s Ai Group Manufacturing PMI rose by 4.9 points to -23.9 in July, indicating a slight improvement but still pointing to a deep contraction in the sector. Meanwhile, the Ai Group Australian Industry Index, a key gauge of private-sector activity, climbed 5.8 points to -3.2, its strongest reading in three years, continuing the gradual recovery trend that began in mid-2024.
- Australia was spared from the latest United States (US) tariff hikes, indicating that President Donald Trump had left the 10% baseline tariffs on Australian goods unchanged.
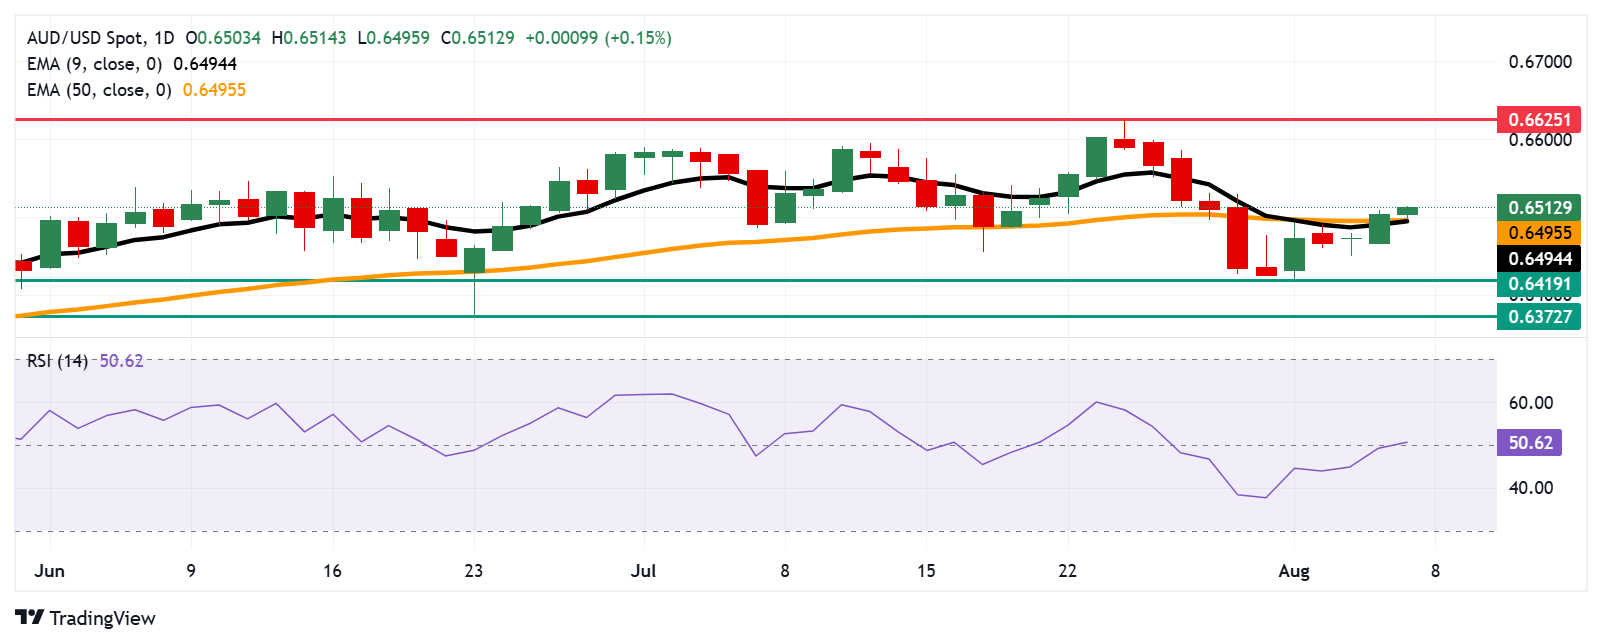
Australian Dollar holds position near 0.6500 after breaking above nine-day EMA
The AUD/USD pair is trading around 0.6500 on Thursday. Technical analysis on the daily chart suggests a bearish bias, with the 14-day Relative Strength Index (RSI) holding below the 50 level. However, the pair has moved above the nine-day Exponential Moving Average (EMA), signaling short-term momentum is stronger.
On the downside, the AUD/USD pair may test the 50-day EMA at 0.6495, aligned with the nine-day EMA at 0.6494. A break below these levels could weaken the short- and medium-term price momentum and put downward pressure on the pair to test the two-month low of 0.6419, which was recorded on August 1, followed by a three-month low at 0.6372, recorded on June 23.
The AUD/USD pair could approach the psychological level of 0.6600, followed by the nine-month high at 0.6625, which was recorded on July 24.
AUD/USD: Daily Chart
Australian Dollar PRICE Today
The table below shows the percentage change of Australian Dollar (AUD) against listed major currencies today. Australian Dollar was the strongest against the Japanese Yen.
| USD | EUR | GBP | JPY | CAD | AUD | NZD | CHF | |
|---|---|---|---|---|---|---|---|---|
| USD | -0.01% | -0.01% | 0.12% | -0.02% | -0.14% | -0.14% | -0.08% | |
| EUR | 0.01% | -0.00% | 0.14% | -0.02% | -0.14% | -0.18% | -0.08% | |
| GBP | 0.00% | 0.00% | 0.16% | 0.00% | -0.12% | -0.17% | -0.05% | |
| JPY | -0.12% | -0.14% | -0.16% | -0.13% | -0.23% | -0.30% | -0.14% | |
| CAD | 0.02% | 0.02% | -0.00% | 0.13% | -0.11% | -0.17% | -0.04% | |
| AUD | 0.14% | 0.14% | 0.12% | 0.23% | 0.11% | -0.04% | 0.08% | |
| NZD | 0.14% | 0.18% | 0.17% | 0.30% | 0.17% | 0.04% | 0.14% | |
| CHF | 0.08% | 0.08% | 0.05% | 0.14% | 0.04% | -0.08% | -0.14% |
The heat map shows percentage changes of major currencies against each other. The base currency is picked from the left column, while the quote currency is picked from the top row. For example, if you pick the Australian Dollar from the left column and move along the horizontal line to the US Dollar, the percentage change displayed in the box will represent AUD (base)/USD (quote).
Economic Indicator
Trade Balance (MoM)
The trade balance released by the Australian Bureau of Statistics is the difference in the value of its imports and exports of Australian goods. Export data can give an important reflection of Australian growth, while imports provide an indication of domestic demand. Trade Balance gives an early indication of the net export performance. If a steady demand in exchange for Australian exports is seen, that would turn into a positive growth in the trade balance, and that should be positive for the AUD.
Last release: Thu Aug 07, 2025 01:30
Frequency: Monthly
Actual: 5,365M
Consensus: 3,250M
Previous: 2,238M
Source: Australian Bureau of Statistics
Related Articles
Amazon Stock Predictions for 2026 to 2030: Will They Exceed Expectations and Achieve Major Long-Term Goals?
TradingKey - As we head into 2026, many investors are questioning where Amazon (AMZN) fits into the technology world.
A Crash After a Surge: Why Silver Lost 40% in a Week?
TradingKey - Spot silver (XAGUSD) prices continue to decline. Silver plunged 20% on Thursday, breaking below $71 per ounce, with the sell-off intensifying on Friday as prices fell further below $64. Compared to the all-time high set on January 29, silver prices have retraced more than 40%, wiping out nearly all gains accumulated over the previous month.
Is Bitcoin’s Four-Year Cycle Dead in 2026?
Is the Bitcoin 4-year cycle dead? After 2025 broke historical records with a red post-halving year, institutional analysts explore if the Bitcoin price has decoupled from the halving countdown. Analyze the impact of spot ETFs, global liquidity, and the roadmap to the 2028 halving in this 2026 market
Why Ripple ETFs are Winning the Capital War Against Bitcoin
While Bitcoin and Ethereum ETFs face massive outflows, XRP ETFs have defied market trends with a historic 30-day inflow streak reaching $1.37 billion. Explore why institutional "smart money" is rotating into Ripple, the structural impact of the "Liquidity Lock," and why analysts set a 2026 price tar