

Bitcoin Price Forecast: BTC rally stalls below $80,000 as ETFs inflows remain strong

- Bitcoin price faces rejection, edges lower on Monday after printing four consecutive weeks of gains.
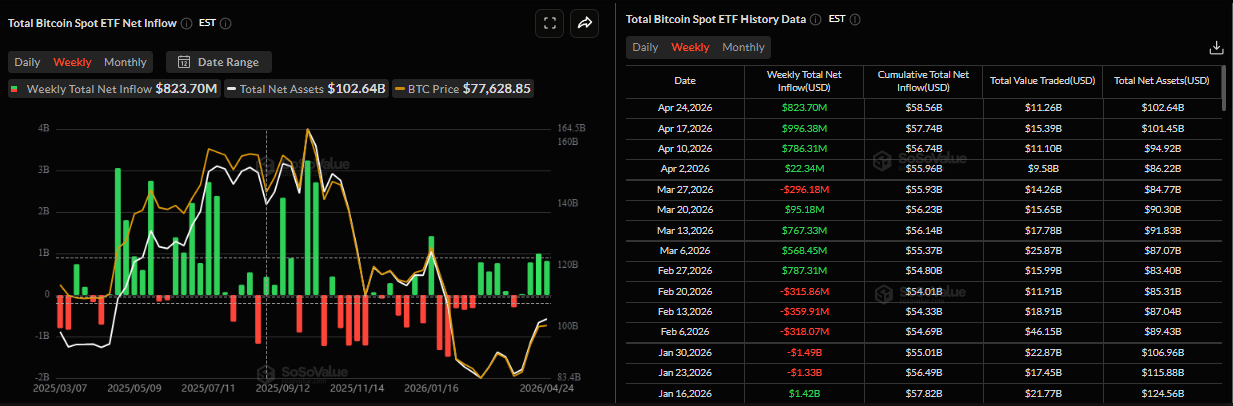
- US-listed spot BTC ETFs recorded inflows of over $820 million last week, marking the fourth straight week of positive flows.
- Geopolitical uncertainty in the Middle East hinders risk sentiment as BTC nears resistance at $80,000.
Bitcoin (BTC) edges slightly lower, trading at $77,700 on Monday, after posting its fourth consecutive weekly gain since late March, maintaining broader bullish momentum intact. Strong institutional demand continues to support the upside, with spot Bitcoin Exchange Traded Funds (ETFs) recording another week of solid inflows. However, as the Crypto King approaches the key $80,000 resistance level, uncertainty surrounding US-Iran peace talks and renewed Strait of Hormuz tensions could keep risk sentiment cautious in the near term.
Institutional demand remains robust
Institutional investors have supported Bitcoin’s price, which continued to rise last week. SoSoValue data show that spot Bitcoin ETFs recorded a net inflow of $823.70 million last week, after an inflow of $996.38 million in the previous one. This marked the fourth straight week of positive flows. If this inflow trend continues and intensifies this week, BTC could see a further rally ahead.
US-Iran conflict still weighs on risk sentiment
Apart from strong institutional demand, the Middle East’s continued uncertainty could weight on short-term risk sentiment among market participants. Iran has reportedly submitted a new proposal to the US to reopen the Strait of Hormuz, bringing an end to the conflict. The plan called for extending the ceasefire so that both countries could work toward a permanent end to the war. The Pakistani mediators gave the proposal to the White House, but it’s unclear whether the US wants to explore it.
US President Donald Trump on Sunday told Jared Kushner and Steve Witkoff to skip the trip to Pakistan, which is mediating talks, saying that Iran “offered a lot, but not enough.” Iranian President Masoud Pezeshkian stated that his nation won’t enter “imposed negotiations under threats or blockade.”
These growing uncertainties dampened short-term risk sentiment, with risk-sensitive assets such as Bitcoin pausing their recent price surge and edging slightly down on Monday.
Bitcoin Price Forecast: Price action suggests rally is not over yet
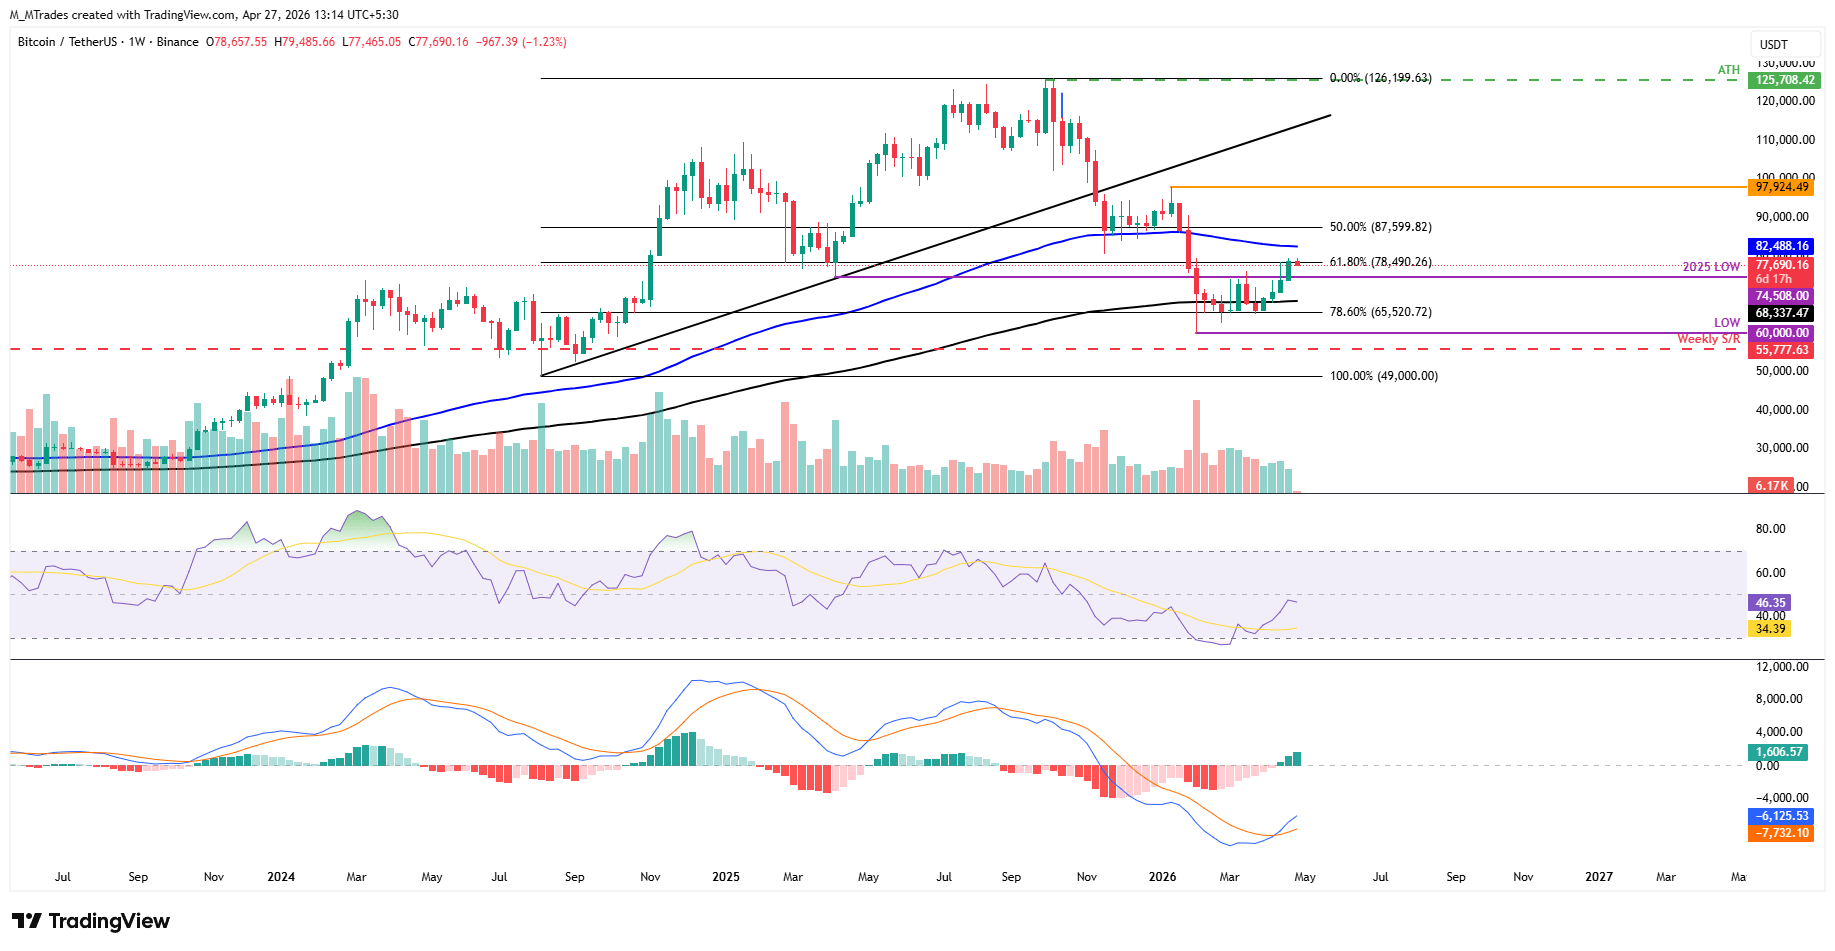
Bitcoin price rose more than 6% last week and closed above the 61.8% Fibonacci retracement level at $78,490 (drawn from the August 2024 low of $49,000 to the October 2025 all-time high of $126,199), the major resistance zone. As of the start of this week, BTC faces slight rejection, near the key $80,000 hurdle, and trades lower at $77,700 on Monday.
If BTC continues its upward move, it could extend the rally toward the the $80,000 psychological hurdle, and then toward the 200-week Exponential Moving Average (EMA) at $82,488.
The Relative Strength Index (RSI) on the weekly chart reads 46, nearing the neutral 50 level, suggesting fading bearish momentum. The Moving Average Convergence Divergence (MACD) indicator on the same chart showed a bullish crossover mid-April, with a rising positive histogram supporting the bullish thesis.
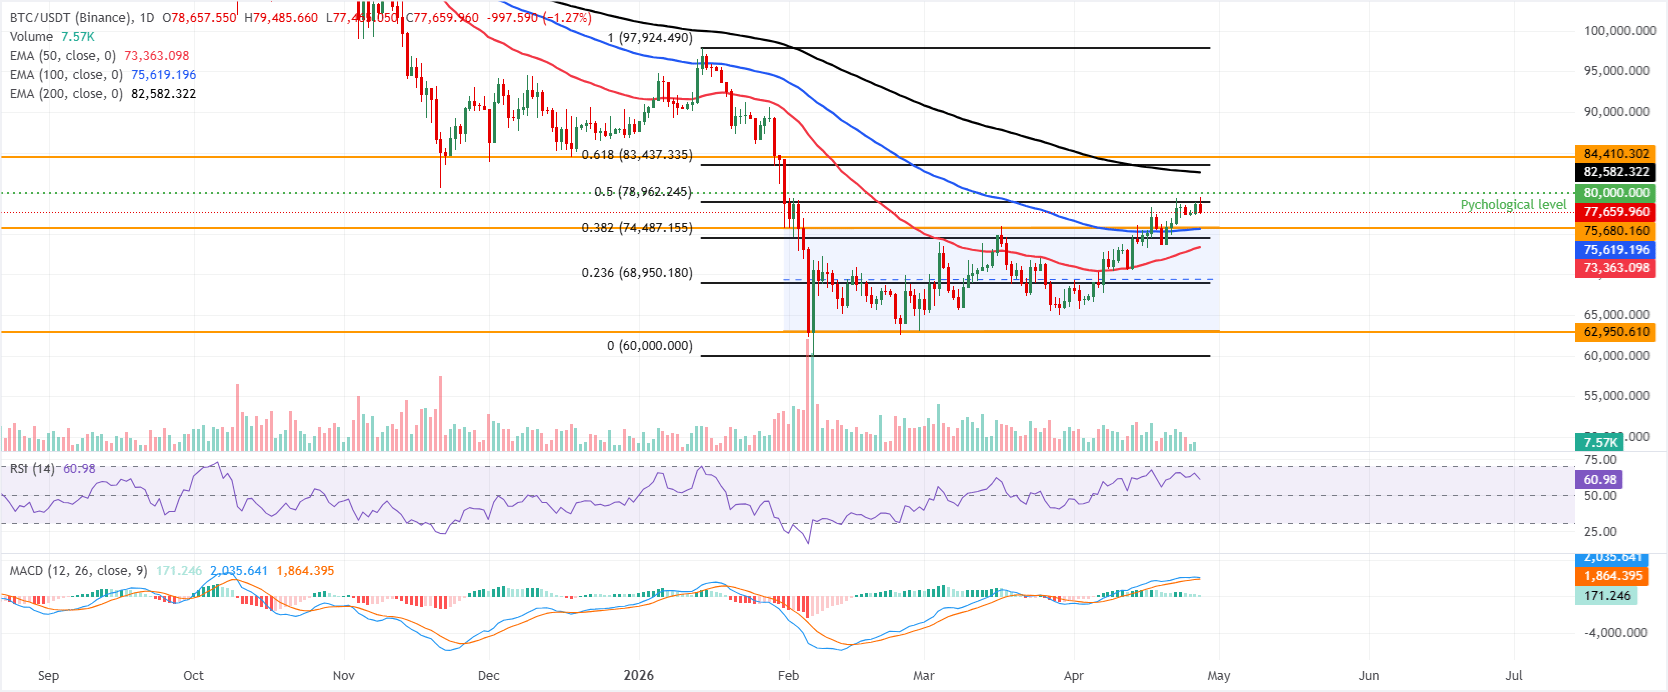
On the daily chart, the Crypto King is holding a constructive bullish bias after rebounding within its upward parallel channel. Price action sits above the 50-day and 100-day EMAs at $73,363 and $75,619, respectively, turning them into underlying dynamic support, while staying well below the 200-day EMA at $82,582, which still caps the broader trend.
Momentum remains positive but not overstretched, with the RSI on the daily chart around 61 and the MACD on the same chart in positive territory, though the MACD line has eased from prior highs, hinting that upside momentum is firming but not accelerating.
On the topside, initial resistance is aligned with the 50% retracement (drawn from January high to February low) at $78,962, ahead of the psychological $80,000 mark. Above that, the 61.8% Fibonacci retracement at $83,437 and the horizontal barrier at $84,410 would be the following targets, while the 200-day EMA at $82,582 remains a key medium-term cap in that cluster of higher hurdles.
On the downside, immediate support is seen near the upper boundary of the horizontal channel at $75,680, followed by the 100-day EMA at $75,619 and the 38.2% Fibonacci retracement at $74,487. Further losses would expose the 50-day EMA at $73,363, with deeper support only emerging at the 23.6% Fibonacci retracement around $68,950 and the channel floor near $63,033, ahead of the structural base at $60,000.
(The technical analysis of this story was written with the help of an AI tool.)
Bitcoin, altcoins, stablecoins FAQs
Bitcoin is the largest cryptocurrency by market capitalization, a virtual currency designed to serve as money. This form of payment cannot be controlled by any one person, group, or entity, which eliminates the need for third-party participation during financial transactions.
Altcoins are any cryptocurrency apart from Bitcoin, but some also regard Ethereum as a non-altcoin because it is from these two cryptocurrencies that forking happens. If this is true, then Litecoin is the first altcoin, forked from the Bitcoin protocol and, therefore, an “improved” version of it.
Stablecoins are cryptocurrencies designed to have a stable price, with their value backed by a reserve of the asset it represents. To achieve this, the value of any one stablecoin is pegged to a commodity or financial instrument, such as the US Dollar (USD), with its supply regulated by an algorithm or demand. The main goal of stablecoins is to provide an on/off-ramp for investors willing to trade and invest in cryptocurrencies. Stablecoins also allow investors to store value since cryptocurrencies, in general, are subject to volatility.
Bitcoin dominance is the ratio of Bitcoin's market capitalization to the total market capitalization of all cryptocurrencies combined. It provides a clear picture of Bitcoin’s interest among investors. A high BTC dominance typically happens before and during a bull run, in which investors resort to investing in relatively stable and high market capitalization cryptocurrency like Bitcoin. A drop in BTC dominance usually means that investors are moving their capital and/or profits to altcoins in a quest for higher returns, which usually triggers an explosion of altcoin rallies.
Recommended Articles


Comments (0)
Click the $ button, enter the symbol, and select to link a stock, ETF, or other ticker.