Top 3 Price Prediction: Bitcoin, Ethereum, Ripple – BTC holds 50-day EMA, ETH and XRP hover near breakdown levels

- Bitcoin price retests the 50-day EMA near $70,700, if it holds, it could support an upside move ahead.
- Ethereum approaches the key support at $2,138, where a breakdown could trigger deeper losses.
- XRP near the horizontal support at $1.30, with a decisive close below suggesting a correction.
Bitcoin (BTC) and Ethereum (ETH) held gains on Monday after rising by over 2.5% and 3.5%, respectively, and Ripple (XRP) stabilized around the key level, the previous week. The top three cryptocurrencies are approaching a critical juncture, as BTC retests its 50-day Exponential Moving Average (EMA) near $70,700, while ETH and XRP hover near crucial support zones, raising the risk of increased volatility in the near term.
Bitcoin nears key 50-day EMA support
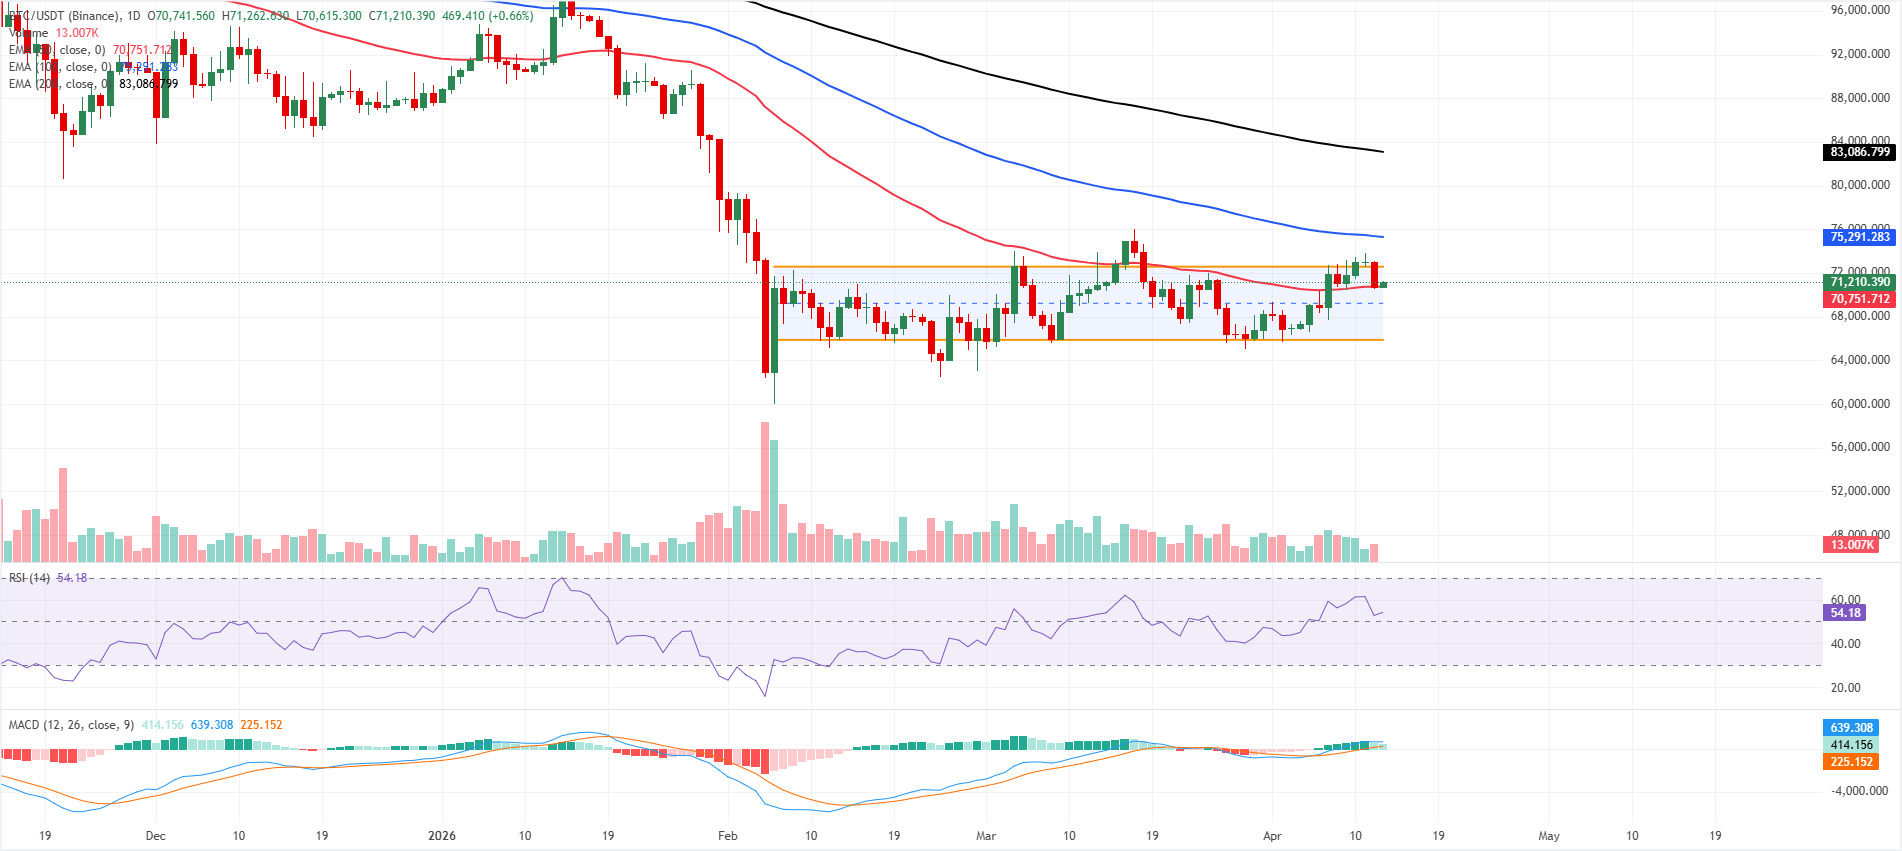
Bitcoin price is trading at $71,210 on Monday, holding just above the 50-day EMA at $70,752 while remaining capped within a parallel channel. The channel’s structure still weighs on the broader outlook, but price action above the short-term EMA hints at a tentative constructive bias.
The Relative Strength Index (RSI) on the daily chart around 54 remains slightly positive without entering overbought territory, while the Moving Average Convergence Divergence (MACD) indicator remains in positive territory, suggesting that bullish momentum has cooled from recent highs.
On the topside, initial resistance is defined by the upper boundary of the channel around $72,576, where a daily close above would open the door to a stronger recovery toward the 100-day EMA at roughly $75,291, ahead of the more distant 200-day EMA near $83,087.
On the downside, immediate support emerges at the 50-day EMA around $70,752; a break below this floor would expose the channel base near $65,872, where buyers would be expected to defend the broader uptrend from deeper corrective pressure.
Ethereum holds above the 50-day EMA
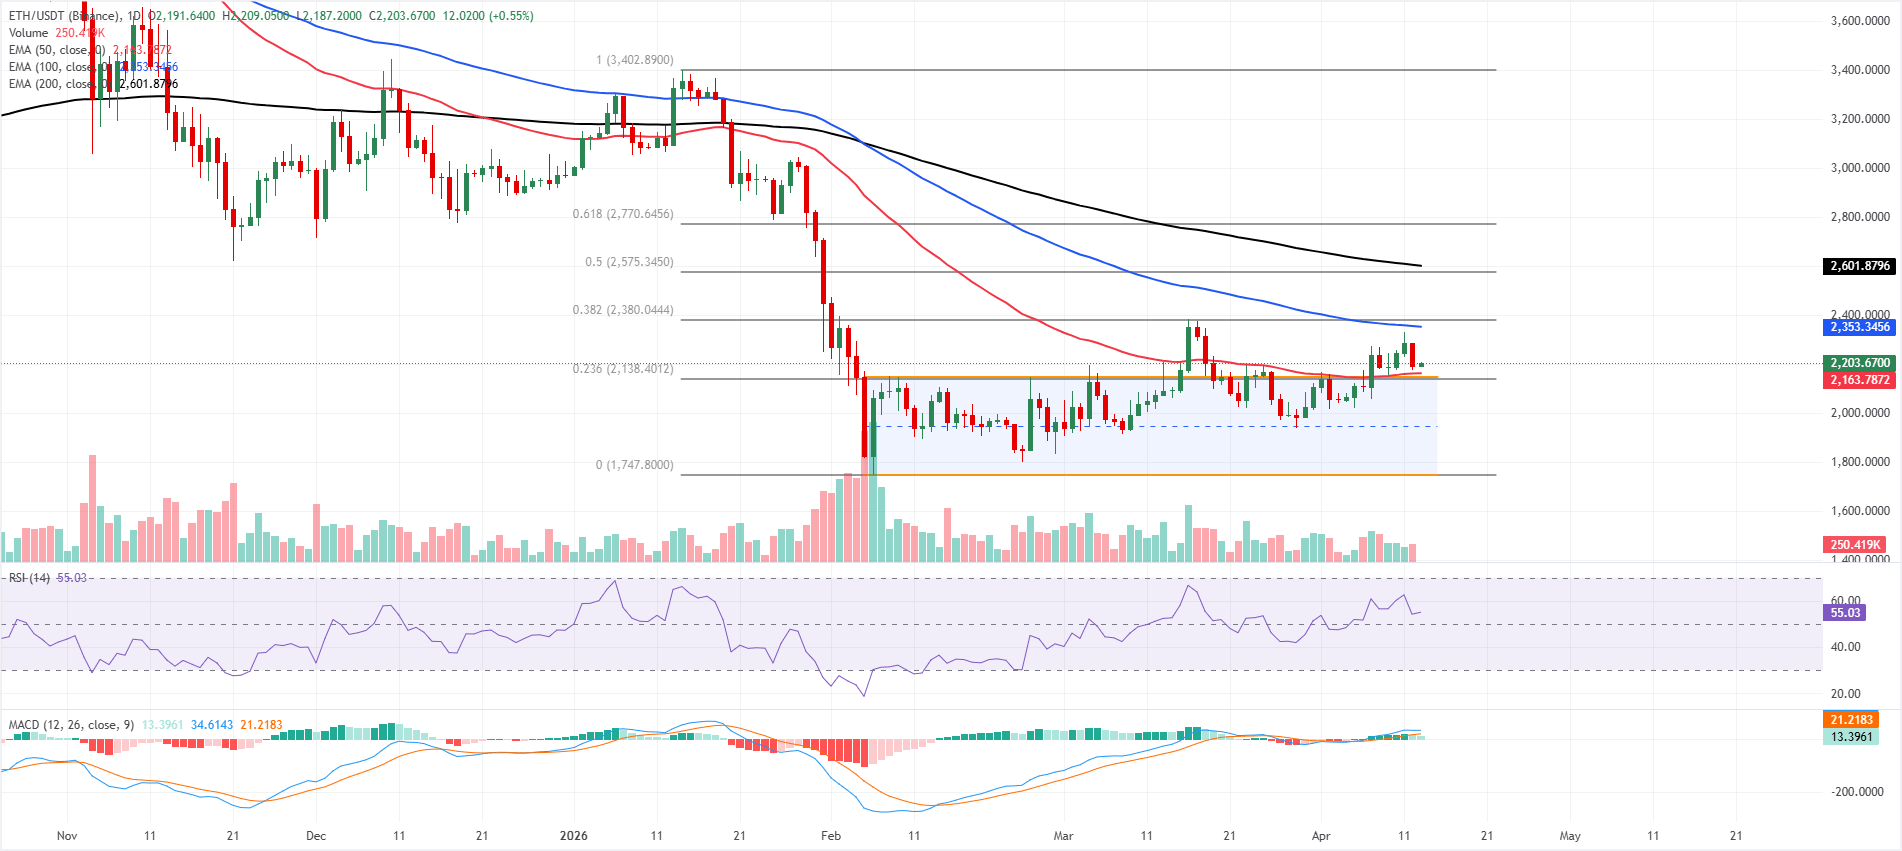
Ethereum price is trading at $2,203 on Monday, with a mildly bullish near-term bias, holding above the 50-day Exponential Moving Average (EMA) at $2,163 and the 23.6% Fibonacci retracement at $2,138.
Price has also pushed above the horizontal channel top near $2,148, hinting at an attempted breakout from the corrective structure, while the RSI on the daily chart is around 55 and a still-positive MACD line suggests constructive but not overextended momentum.
On the topside, initial resistance is seen near the 38.2% Fibonacci retracement at $2,380, followed by the 100-day EMA at roughly $2,353 and then the more distant 200-day EMA around $2,602, which together define a broader supply band.
On the downside, immediate support is located around today’s pivot area at $2,203, ahead of the 50-day EMA at $2,163, the reclaimed channel boundary at $2,148, and the 23.6% retracement at $2,138; a sustained break below that cluster would expose the channel floor near $1,748 as the next major bearish objective.
XRP nears key support at $1.30
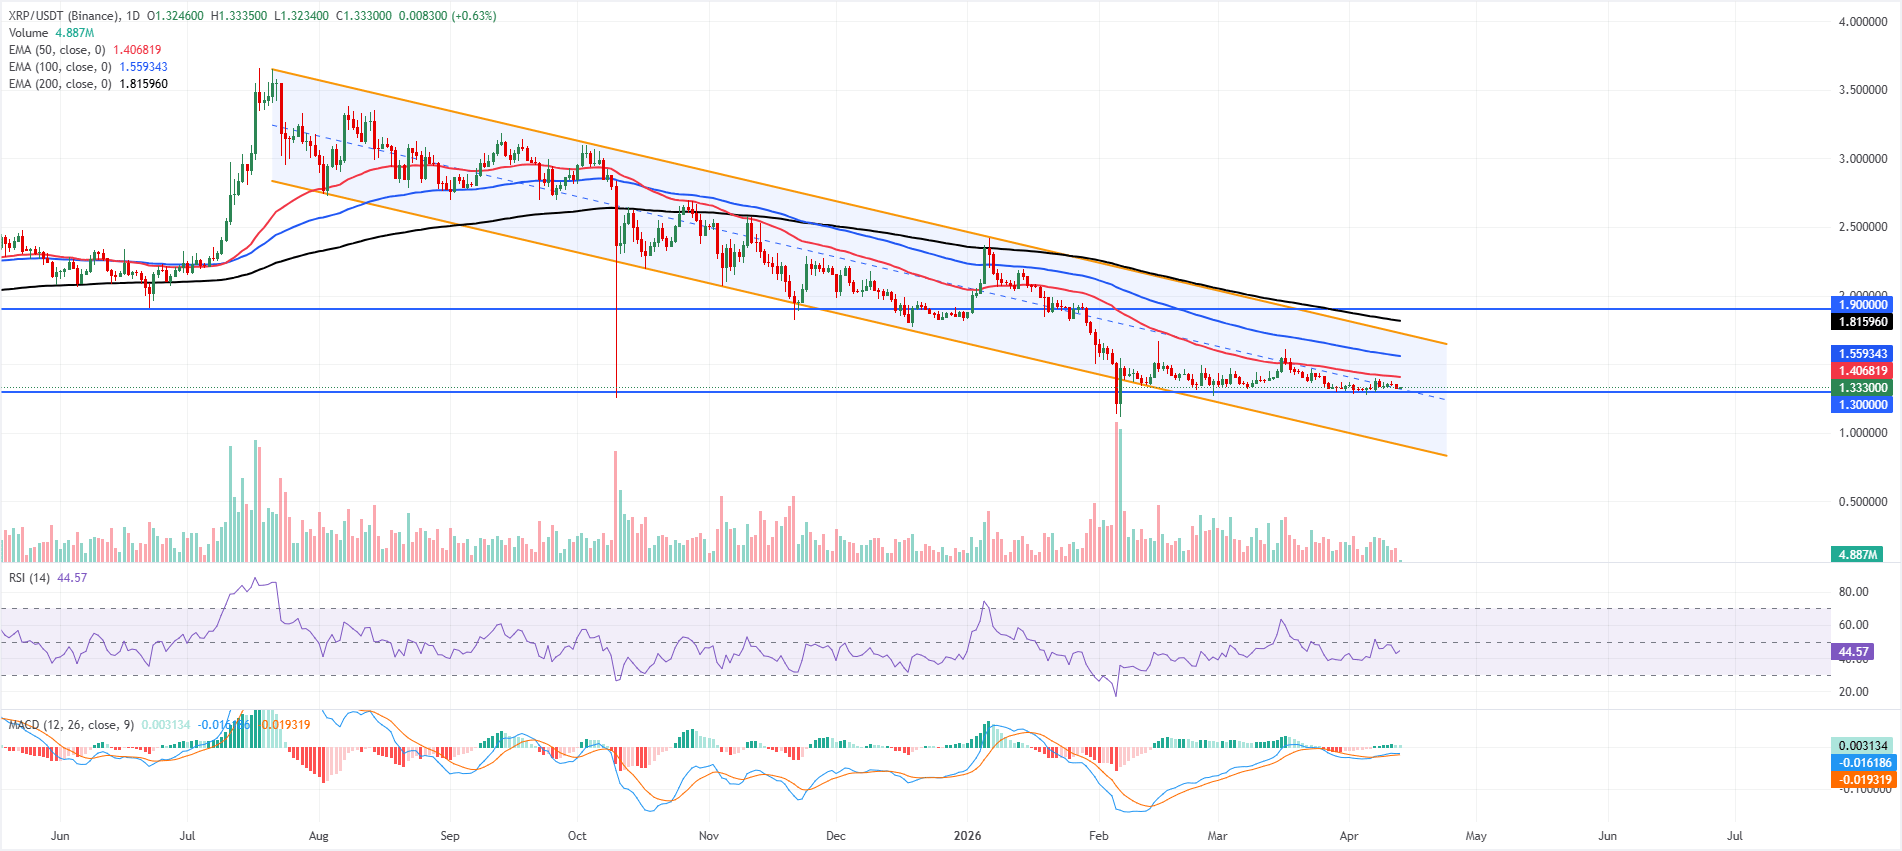
XRP price is trading at $1.33 on Monday, maintaining a bearish bias as it holds below the 50-day, 100-day, and 200-day EMAs at $1.41, $1.56, and $1.82, respectively, all of which act as overhead supply within a broader downward channel.
The RSI on the daily chart is around 45, leaning slightly to the bearish side but avoiding oversold territory, while the MACD remains marginally positive, hinting that any rebounds are likely corrective while the pair stays capped beneath this cluster of EMAs.
On the topside, initial resistance is located at the 50-day EMA near $1.41, followed by the 100-day EMA around $1.56, with the upper boundary of the descending channel near $1.73 and the 200-day EMA at about $1.82, adding to a dense resistance band ahead of the horizontal ceiling at $1.90.
On the downside, immediate support lies at the horizontal level of $1.30, with the channel’s lower boundary near $0.91 providing a deeper structural floor if selling pressure resumes.
(The technical analysis of this story was written with the help of an AI tool.)
Cryptocurrency prices FAQs
Token launches influence demand and adoption among market participants. Listings on crypto exchanges deepen the liquidity for an asset and add new participants to an asset’s network. This is typically bullish for a digital asset.
A hack is an event in which an attacker captures a large volume of the asset from a DeFi bridge or hot wallet of an exchange or any other crypto platform via exploits, bugs or other methods. The exploiter then transfers these tokens out of the exchange platforms to ultimately sell or swap the assets for other cryptocurrencies or stablecoins. Such events often involve an en masse panic triggering a sell-off in the affected assets.
Macroeconomic events like the US Federal Reserve’s decision on interest rates influence crypto assets mainly through the direct impact they have on the US Dollar. An increase in interest rate typically negatively influences Bitcoin and altcoin prices, and vice versa. If the US Dollar index declines, risk assets and associated leverage for trading gets cheaper, in turn driving crypto prices higher.
Halvings are typically considered bullish events as they slash the block reward in half for miners, constricting the supply of the asset. At consistent demand if the supply reduces, the asset’s price climbs.
Recommended Articles