Crypto Market Overview: Bitcoin ends 5-month losing streak while US seeks Iran exit plan – ALGO, STABLE, NIGHT lead gains

- Bitcoin hovers below $68,000 on Wednesday after securing a positive monthly close to break the streak of five consecutive monthly losses.
- The US President Donald Trump expects the war to end in two to three weeks.
- Algorand, Stable, and Midnight lead gains over the last 24 hours.
Bitcoin (BTC) hovers slightly below $68,000 at press time on Wednesday after a 2% gain in March, ending the streak of five consecutive bearish months. Meanwhile, the US President Donald Trump foresees the Iran war ending in two or three weeks, which aligns with his earlier-mentioned six-week deadline. Meanwhile, Algorand (ALGO), Stable (STABLE), and Midnight (NIGHT) are leading gains over the last 24 hours.
US seeks exit strategy from Iran
The US-Iran war enters its second month, fueling Oil prices above $100 and weighing on global financial markets. US President Donald Trump said in an interview that the US could end the war in two or three weeks, regardless of whether the peace talks reach a conclusion or the Strait of Hormuz reopens.
However, the US Secretary of State Marco Rubio said in an interview with Fox News, “We’re going to keep trying. There are messages being exchanged,” suggesting that talks with Iran are ongoing and will persist after the war.
Top Crypto Gainers: Algorand, Stable, Midnight rebound
Algorand is up over 3% at press time on Wednesday, building on the 14% gains the previous day. The near-term bias is cautiously bullish after the pair rebounded from the lower end of its recent range and pushed through the descending trend-line resistance. Daily closes remain above the 50-day Exponential Moving Average (EMA), which sits well below the 100- and 200-day EMAs, suggesting a short-term recovery in a broader downward trend.
However, the Moving Average Convergence Divergence (MACD) line has turned up above its signal line near the zero line, and the histogram is expanding, suggesting improving upside momentum. The Relative Strength Index (RSI) at 63 moves out of neutral territory, reinforcing building buying pressure rather than overbought conditions for now.
On the upside, resistance comes in at the 50% retracement of the $0.0807 to $0.1456 decline at $0.1083, near the 100-day EMA at $0.1060. A daily close above that zone would open the way toward the 78.6% Fibonacci retracement at $0.1283 and would strengthen the bullish case.
Initial support is seen at the 23.6% Fibonacci retracement level at $0.0927, close to the 50-day EMA at $0.0919.
On the other hand, Stable holds steady at the time of writing on Wednesday, after an 18% jump the previous day. The near-term bias is cautiously bullish as price holds above the 50-day EMA at $0.0261 and extends the rebound from the late-March trough. The 100-day EMA at $0.0224 trends higher beneath STABLE, reinforcing an improving medium-term structure.
Momentum supports the upside tilt, with the RSI at 56, hovering in the mid-50s, and the MACD crossing above its signal line, suggesting strengthening bullish pressure after a prolonged flat phase below zero.
On the topside, immediate resistance is located at $0.0290, ahead of last week’s high near $0.0298. A daily close above $0.0298 would open the way toward the $0.0305–$0.0310 zone, where the pair would extend the current recovery leg.
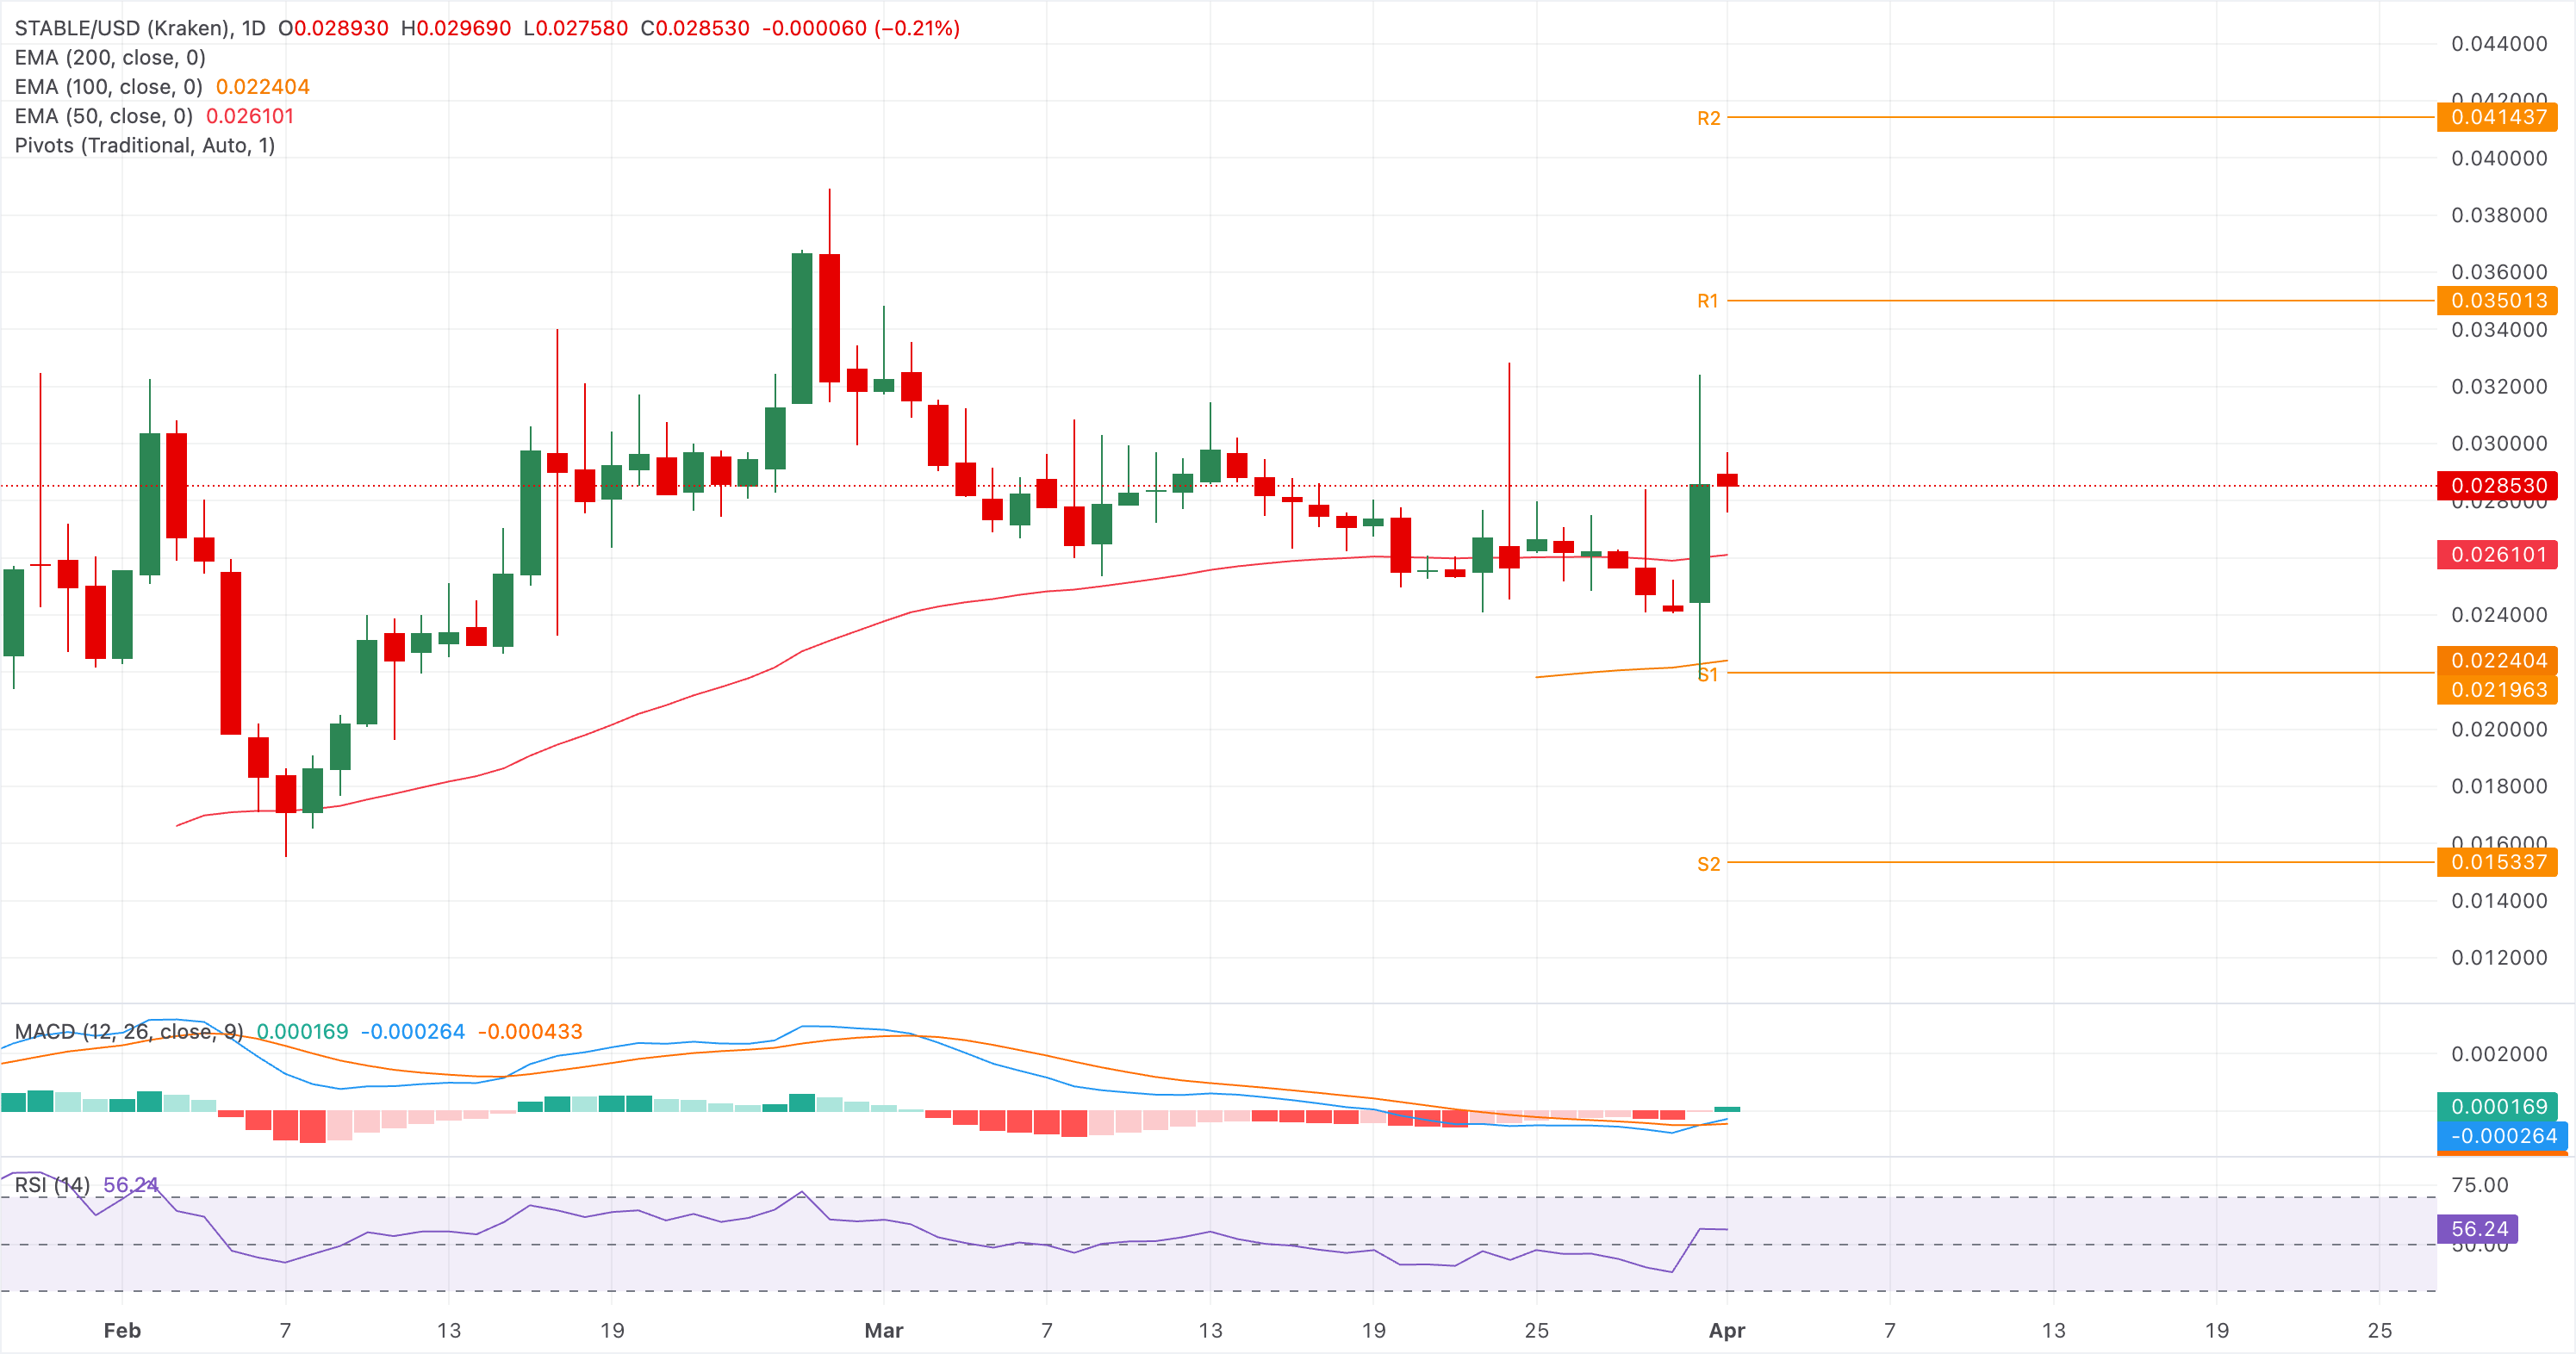
Initial support emerges at $0.0280, where recent intraday pullbacks found demand, followed by firmer support at the 50-day EMA at $0.0261. A break below this latter area would expose the late-March swing low at $0.0241 as the next downside level.
Similarly, Midnight holds steady so far on Wednesday after a 10% rebound the previous day. The near-term tone turns cautiously bullish after price stabilized above the recent $0.0430–$0.0420 floor and bounced back toward the prior range.
The MACD histogram has flipped positive, and the MACD line holds just above the signal line, suggesting improving upside momentum. The RSI at 48 stays close to the midline, reinforcing a recovering but still modest bullish bias rather than a decisive trend. A daily close above the rising 50-day EMA at $0.0527 would strengthen this constructive shift, targeting the 23.6% Fibonacci retracement at $0.0601, measured from the $0.1199 high to the $0.0416 low.
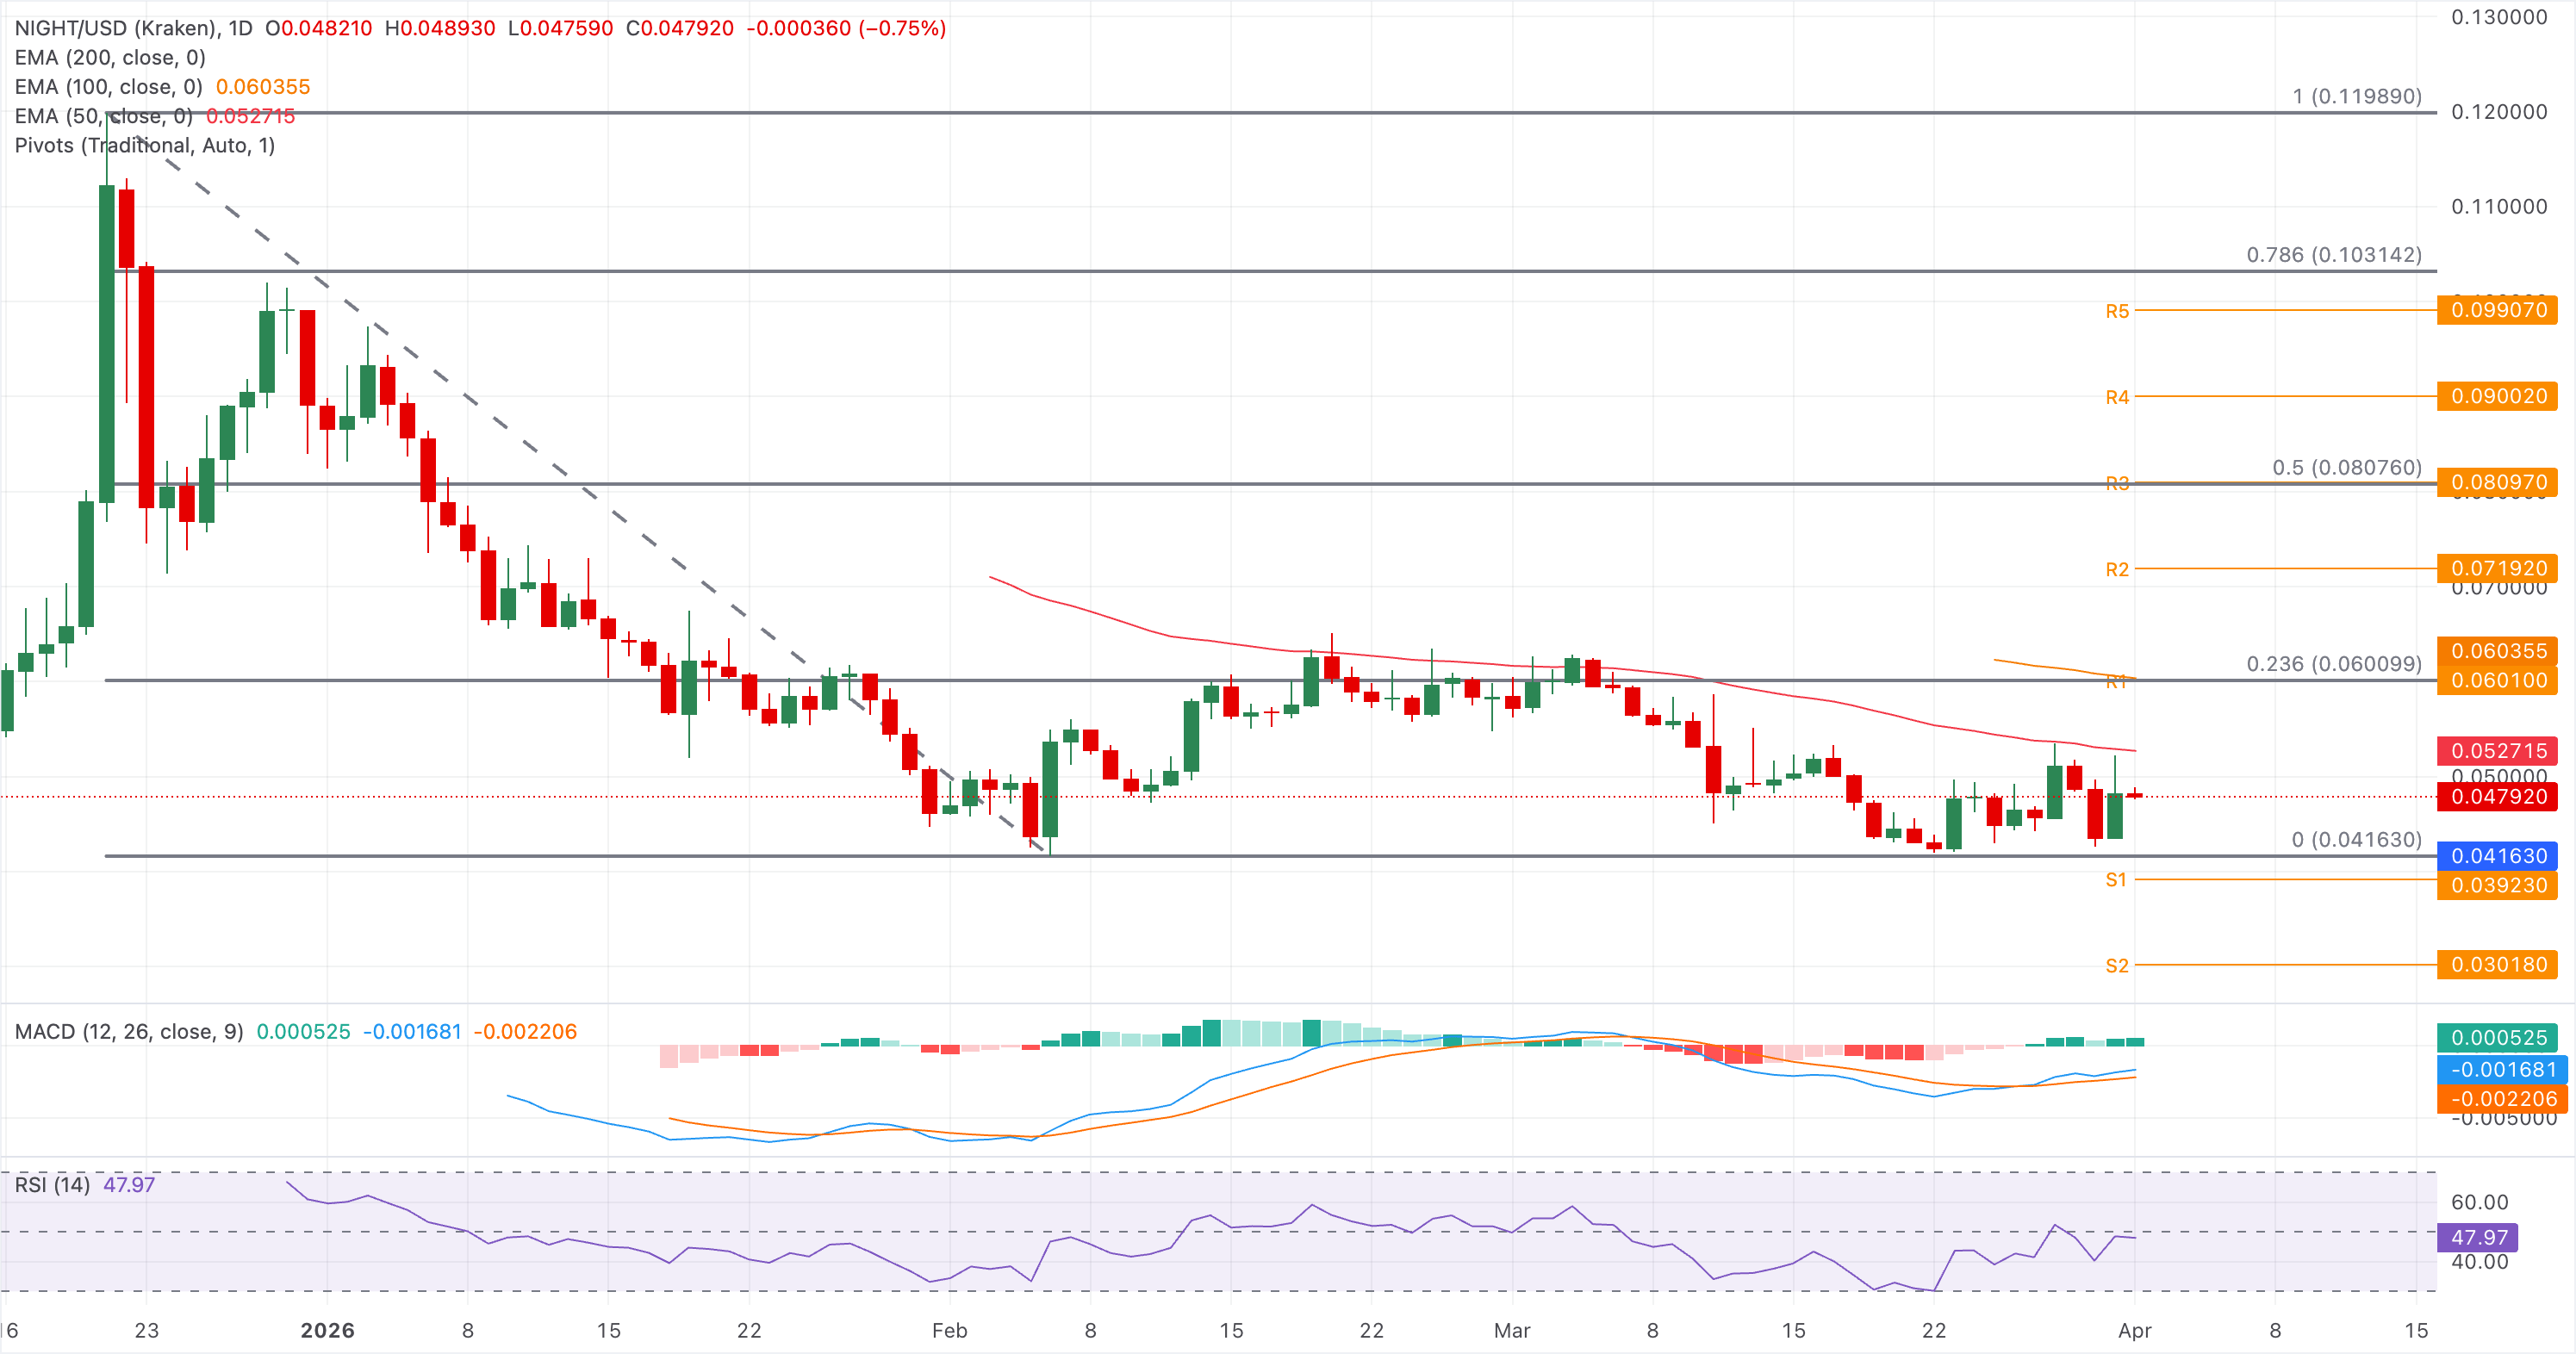
Initial support emerges at $0.0470, ahead of the stronger $0.0435 area that guarded the recent lows, with a deeper setback exposing $0.0416.
(The technical analysis of this story was written with the help of an AI tool.)