

Bitcoin’s Decay Signals the Most Severe Bearish Pivot Since the LUNA Collapse – A 2022 Echo

Bitcoin is struggling to hold the $65,000 level as market sentiment drifts toward apathy following weeks of muted price action and declining participation. Volatility has compressed noticeably, and traders appear hesitant to commit fresh capital while macro uncertainty and liquidity constraints continue to weigh on risk assets. The lack of decisive momentum has left Bitcoin consolidating near a technically sensitive zone, where both bulls and bears seem reluctant to take aggressive positions.
A recent CryptoQuant report provides additional context through on-chain positioning data. According to the analysis, during the early February correction, the indicator dropped to roughly -0.0016, reflecting measurable weakness in underlying network activity. This development occurred after Bitcoin had already closed below the Anchored Volume Weighted Average Price (AVWAP) tied to the most recent halving on the weekly timeframe — a level often monitored as a structural reference for market positioning.
Trading below this anchored metric suggests reduced conviction among market participants and potentially weaker cost-basis support. While such conditions do not necessarily imply imminent downside, they typically correspond with transitional phases marked by uncertainty, subdued participation, and cautious capital deployment as the market searches for directional clarity.
Bearish Confluence Signals Echo Prior Cycle Dynamics
The report highlights that the last comparable bearish confluence following an all-time high occurred in May 2022, a period that ultimately preceded a prolonged corrective phase. According to the analysis, this comparison is based on a combination of structural indicators rather than isolated price action, specifically the BTC Growth Rate Difference between Market Cap and Realized Cap — an indicator developed by CryptoQuant CEO Ki Young Ju — alongside Anchored VWAP levels tied to the third and fourth Bitcoin halvings.

The Growth Rate Difference metric evaluates whether market capitalization expansion is outpacing the underlying realized capitalization, which reflects the aggregated cost basis of coins on-chain. When this gap narrows or turns negative, it often signals weakening speculative momentum and reduced capital inflows relative to existing holder positioning.
At the same time, Bitcoin trading below key halving-anchored AVWAP levels suggests diminished structural support from long-term cost bases. Historically, these levels have functioned as reference zones for institutional and macro-oriented investors.
Together, these indicators do not guarantee further downside, but they do indicate a fragile market structure. Such conditions typically require either renewed liquidity inflows or sustained accumulation before a convincing recovery phase can develop.
Bitcoin Price Tests Key Support As Downtrend Persists
Bitcoin’s weekly structure continues to reflect a corrective phase, with price struggling to stabilize near the mid-$60,000 range after a sharp rejection from the $110,000–$120,000 zone seen late last year. The chart shows a clear transition from bullish expansion to distribution, followed by a sustained sequence of lower highs and lower lows — a pattern typically associated with weakening momentum rather than consolidation.
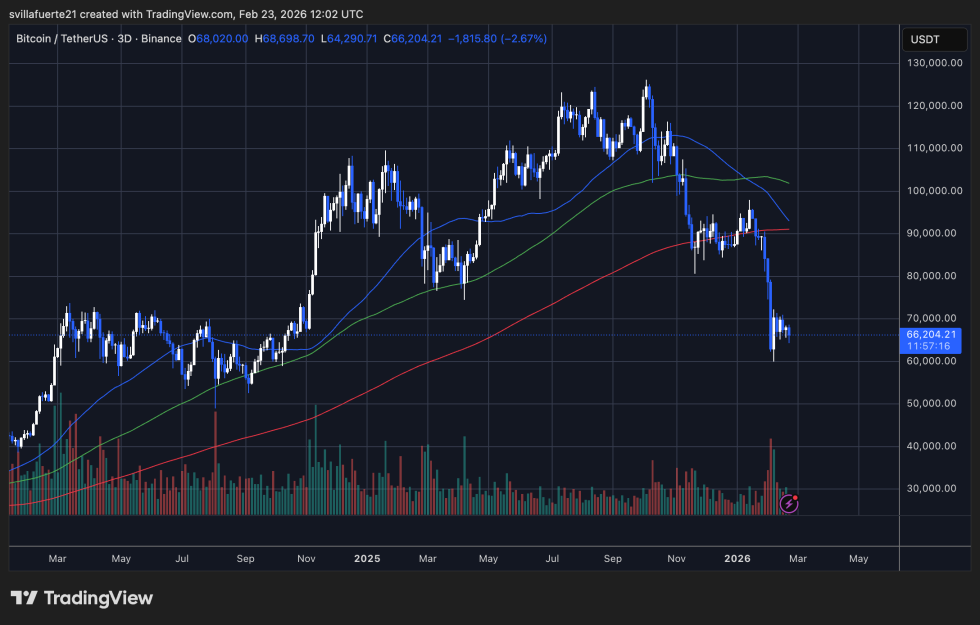
Technically, Bitcoin is now trading below major moving averages that previously acted as dynamic support. The shorter-term average has already rolled over decisively, while the longer-term trend line remains upward sloping but increasingly distant from current price action. Sustained trading beneath these levels usually reflects cautious sentiment and reduced upside conviction.
Volume spikes during recent selloffs suggest active distribution rather than passive drift lower. However, declining participation afterward could indicate partial exhaustion of aggressive sellers, potentially opening the door for a stabilization phase if demand returns.
From a structural perspective, the $60,000–$62,000 zone appears to function as immediate support, while the $70,000–$75,000 range represents the first meaningful resistance band. Unless Bitcoin decisively reclaims higher levels with strong volume, the broader trend remains fragile, with consolidation or additional downside risk still plausible.
Featured image from ChatGPT, chart from TradingView.com
Related Articles
International Copper Prices Rise for 7 Straight Months; Will Bull Market Continue in 2026?
TradingKey - As the "king of industrial metals," every fluctuation in international copper prices impacts the nerves of global investors. In early 2026, international copper prices continued to rise, extending the upward trend from 2025 and reaching a new high above $14,500, marking seven consecutive months of gains. Meanwhile, London Metal Exchange (LME) copper prices have climbed from $7,800 per tonne in July 2025 to over $9,000 per tonne today.
Nikkei Index Heading Toward 60,000? Why Is Global Capital Betting on Sanae Takaichi? Will Japan’s Stock Market Continue to Hit New Highs in 2026?
TradingKey - In February 2026, the Tokyo stock market once again became the epicenter of global financial markets. Following a landslide victory by the Sanae Takaichi-led Liberal Democratic Party in the Lower House elections, the Nikkei 225 Index hit consecutive record highs within just a few days, targeting the 60,000-point milestone.
Is SaaS Dead? The Truth Behind the Software Meltdown, the Missing Floor, and the Peak That’s Not Coming Back
TradingKey - A trillion dollars just vanished from software stocks—this piece breaks down who AI is really killing, who quietly benefits, and why cheap SaaS may be the biggest value trap of this cycle.
USD Dollar Trend Forecast: Dollar Index Falls Below 97.0 to 4-Year Low, Will the Dollar Continue To Fall or Bottom Out in 2026?
TradingKey - In January 2026, the US Dollar Index continued its downward trend from 2025, officially breaking below the key 97.0 level and reaching a low of 95.5, marking a nearly four-year low since February 2022.

