

Decred Price Prediction: DCR gears up for a breakout amid falling market

- Decred rises 5% on Monday, building on over 6% gains from last week.
- Tight liquidity and steady treasury buildup cap downside risk and boost upside moves.
- The technical outlook focuses on the crucial resistance with bulls aiming for a breakout rally.
Decred (DCR) extends gains by 5% at press time on Monday for the fifth consecutive day, with bulls challenging a crucial resistance level. The low liquidity of DCR tokens in the market, driven by steady user staking and treasury buildup, fuels upside moves. Technically, Decred is at a crucial crossroads amid rising buying pressure.
Limited supply boosts DCR demand
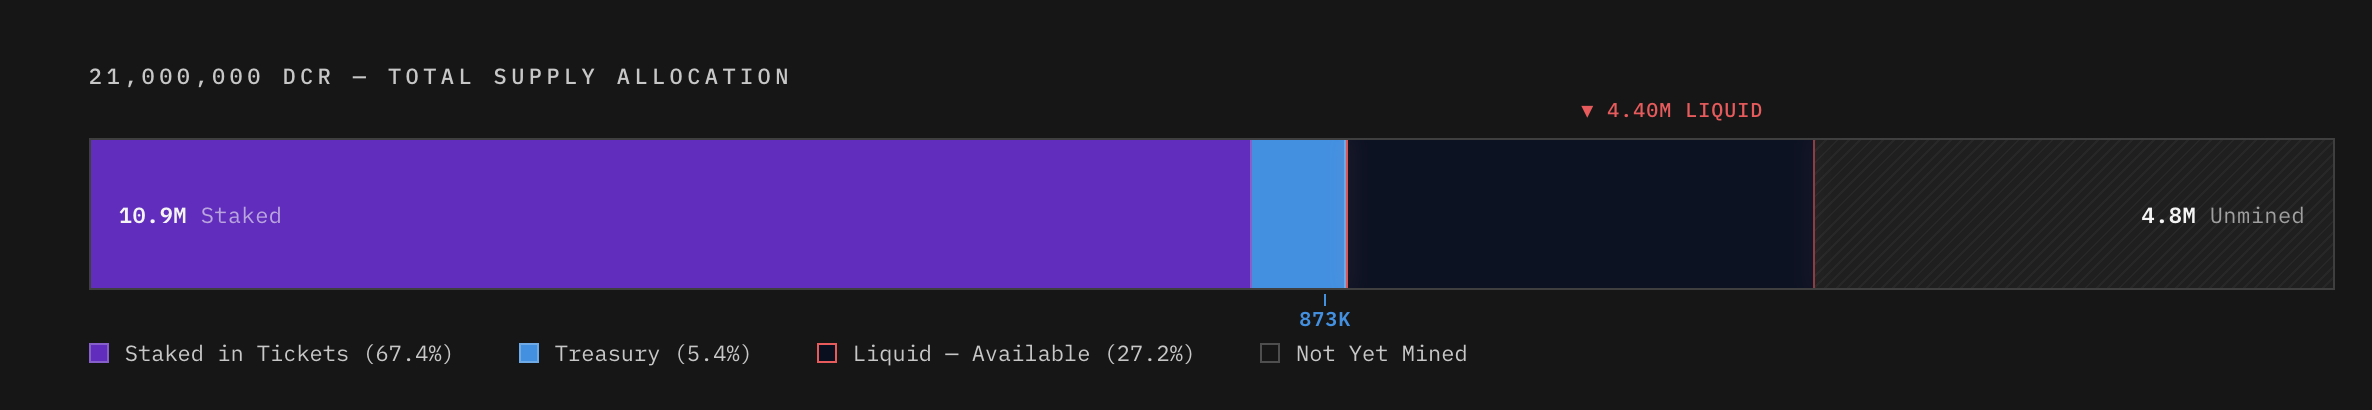
On-chain data shows 10.9 million DCR is staked, representing 67.4% of all mined DCR (16.2 million DCR), and cannot be sold for 142 days. Additionally, the treasury holds over 873,000 DCR tokens, removing 5.4% from the circulating supply, limiting the liquidity to 4.40 million DCR. The limited supply in the market boosts demand for the privacy coin among investors.
Technical outlook: Will Decred extend gains for a breakout rally?
Decred is up 5% at the time of writing on Monday, crossing above the $25.00 level. The short-term recovery tests the 38.2% Fibonacci retracement level at $26.13, measured from the November 4 high at $70 to the December 23 low at $14.21. The crucial resistance has previously capped gains since late November, showcasing intense supply pressure.
A decisive close above this level could target the 50% and 61.8% Fibonacci retracement levels at $31.54 and $38.07, respectively.
The Relative Strength Index (RSI) is at 63 on the daily chart, edging higher, extending its rebound from the halfway line as buying pressure increases. The indicator shows further upside before reaching the overbought zone, suggesting bullish potential. The Moving Average Convergence Divergence (MACD) crosses above its signal line, signaling renewed bullish momentum.

However, a downside reversal from $26.13 could signal renewed downside pressure, opening the door to a retest of the 50-day Exponential Moving Average (EMA) at $21.96.
Related Articles
Telemedicine and Telehealth Stocks to Watch in 2026
TradingKey - The healthcare system was one of the first industries to go through a major transformation; now, investors are watching closely. Every day, we see new technology being created for diagnosing and treating diseases. The method of delivery in allowing patients access to care has changed al
How Bitcoin Miners Are Scaling Revenue Through AI Data Center Integration
Discover how Bitcoin miners like Core Scientific and IREN are scaling revenue by pivoting to AI data centers. Explore 2026 hashprice trends, ASIC-to-GPU retrofitting, and the "hashrate-to-HPC" revolution.
Nikkei Index Heading Toward 60,000? Why Is Global Capital Betting on Sanae Takaichi? Will Japan’s Stock Market Continue to Hit New Highs in 2026?
TradingKey - In February 2026, the Tokyo stock market once again became the epicenter of global financial markets. Following a landslide victory by the Sanae Takaichi-led Liberal Democratic Party in the Lower House elections, the Nikkei 225 Index hit consecutive record highs within just a few days, targeting the 60,000-point milestone.
Stock Market Crash 2026: What Fed Signals and Economic Data Mean for Investors
TradingKey - The possibility of a stock market crash occurring in 2026 is becoming increasingly likely as investor sentiment continues to decline.
New Fed Chair Warsh Takes Office: Major Shift in Monetary Policy? US Dollar Short-Term Rebound, 2026 Investment Strategy Analysis
TradingKey - At the start of 2026, global financial markets witnessed a major leadership change as U.S. President Trump officially nominated Kevin Warsh as the next Federal Reserve Chair. Pending Senate confirmation, he will succeed Jerome Powell this May to lead the world’s most influential central bank.
