

Solana (SOL) Loses $80 Floor, Downtrend Signals Intensify Rapidly Across Broader Crypto Space

Solana failed to settle above $92 and extended losses. SOL price is now consolidating losses below $85 and might struggle to start a recovery wave.
- SOL price started a fresh decline below $85 and $82 against the US Dollar.
- The price is now trading below $82 and the 100-hourly simple moving average.
- There is a key bearish trend line forming with resistance at $82 on the hourly chart of the SOL/USD pair (data source from Kraken).
- The price could start a recovery wave if the bulls defend $75 or $70.
Solana Price Dips Over 5%
Solana price failed to remain stable above $95 and started a fresh decline, like Bitcoin and Ethereum. SOL declined below the $90 and $85 support levels.
The price gained bearish momentum below $82. A low was formed at $77.30, and the price is now consolidating losses with a bearish angle below the 23.6% Fib retracement level of the downward move from the $86.68 swing high to the $77.30 low.
Solana is now trading below $80 and the 100-hourly simple moving average. On the upside, immediate resistance is near the $80 level. The next major resistance is near the $82 level or the 50% Fib retracement level of the downward move from the $86.68 swing high to the $77.30 low. There is also a key bearish trend line forming with resistance at $82 on the hourly chart of the SOL/USD pair.
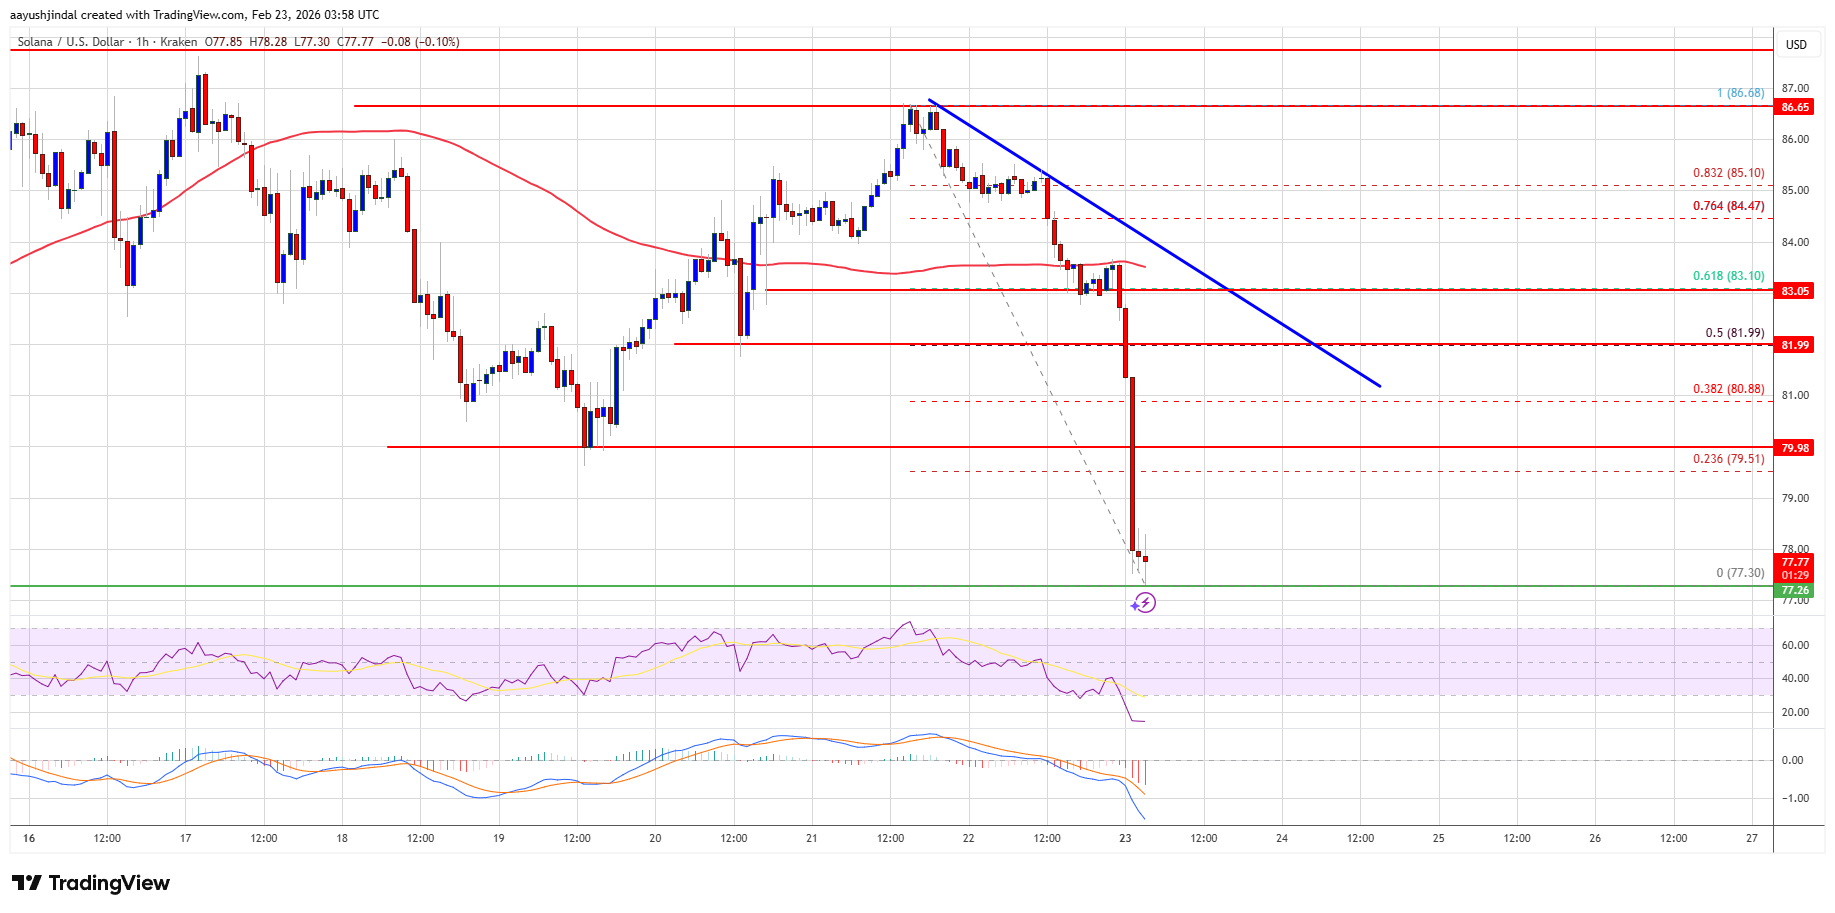
The main resistance could be $83.10. A successful close above the $83.10 resistance zone could set the pace for another steady increase. The next key resistance is $87. Any more gains might send the price toward the $92 level.
More Losses In SOL?
If SOL fails to rise above the $82 resistance, it could continue to move down. Initial support on the downside is near the $77 zone. The first major support is near the $75 level.
A break below the $75 level might send the price toward the $70 support zone. If there is a close below the $70 support, the price could decline toward the $62 support in the near term.
Technical Indicators
Hourly MACD – The MACD for SOL/USD is gaining pace in the bearish zone.
Hourly Hours RSI (Relative Strength Index) – The RSI for SOL/USD is below the 50 level.
Major Support Levels – $77 and $75.
Major Resistance Levels – $80 and $82.
Related Articles
Nikkei Index Heading Toward 60,000? Why Is Global Capital Betting on Sanae Takaichi? Will Japan’s Stock Market Continue to Hit New Highs in 2026?
TradingKey - In February 2026, the Tokyo stock market once again became the epicenter of global financial markets. Following a landslide victory by the Sanae Takaichi-led Liberal Democratic Party in the Lower House elections, the Nikkei 225 Index hit consecutive record highs within just a few days, targeting the 60,000-point milestone.
Stock Market Crash 2026: What Fed Signals and Economic Data Mean for Investors
TradingKey - The possibility of a stock market crash occurring in 2026 is becoming increasingly likely as investor sentiment continues to decline.
New Fed Chair Warsh Takes Office: Major Shift in Monetary Policy? US Dollar Short-Term Rebound, 2026 Investment Strategy Analysis
TradingKey - At the start of 2026, global financial markets witnessed a major leadership change as U.S. President Trump officially nominated Kevin Warsh as the next Federal Reserve Chair. Pending Senate confirmation, he will succeed Jerome Powell this May to lead the world’s most influential central bank.
Is Bitcoin’s Four-Year Cycle Dead in 2026?
Is the Bitcoin 4-year cycle dead? After 2025 broke historical records with a red post-halving year, institutional analysts explore if the Bitcoin price has decoupled from the halving countdown. Analyze the impact of spot ETFs, global liquidity, and the roadmap to the 2028 halving in this 2026 market

