Crypto Today: Bitcoin, Ethereum, XRP trade within range amid low retail interest

- Bitcoin price holds above $68,000, weighed down by low retail activity and weak technicals.
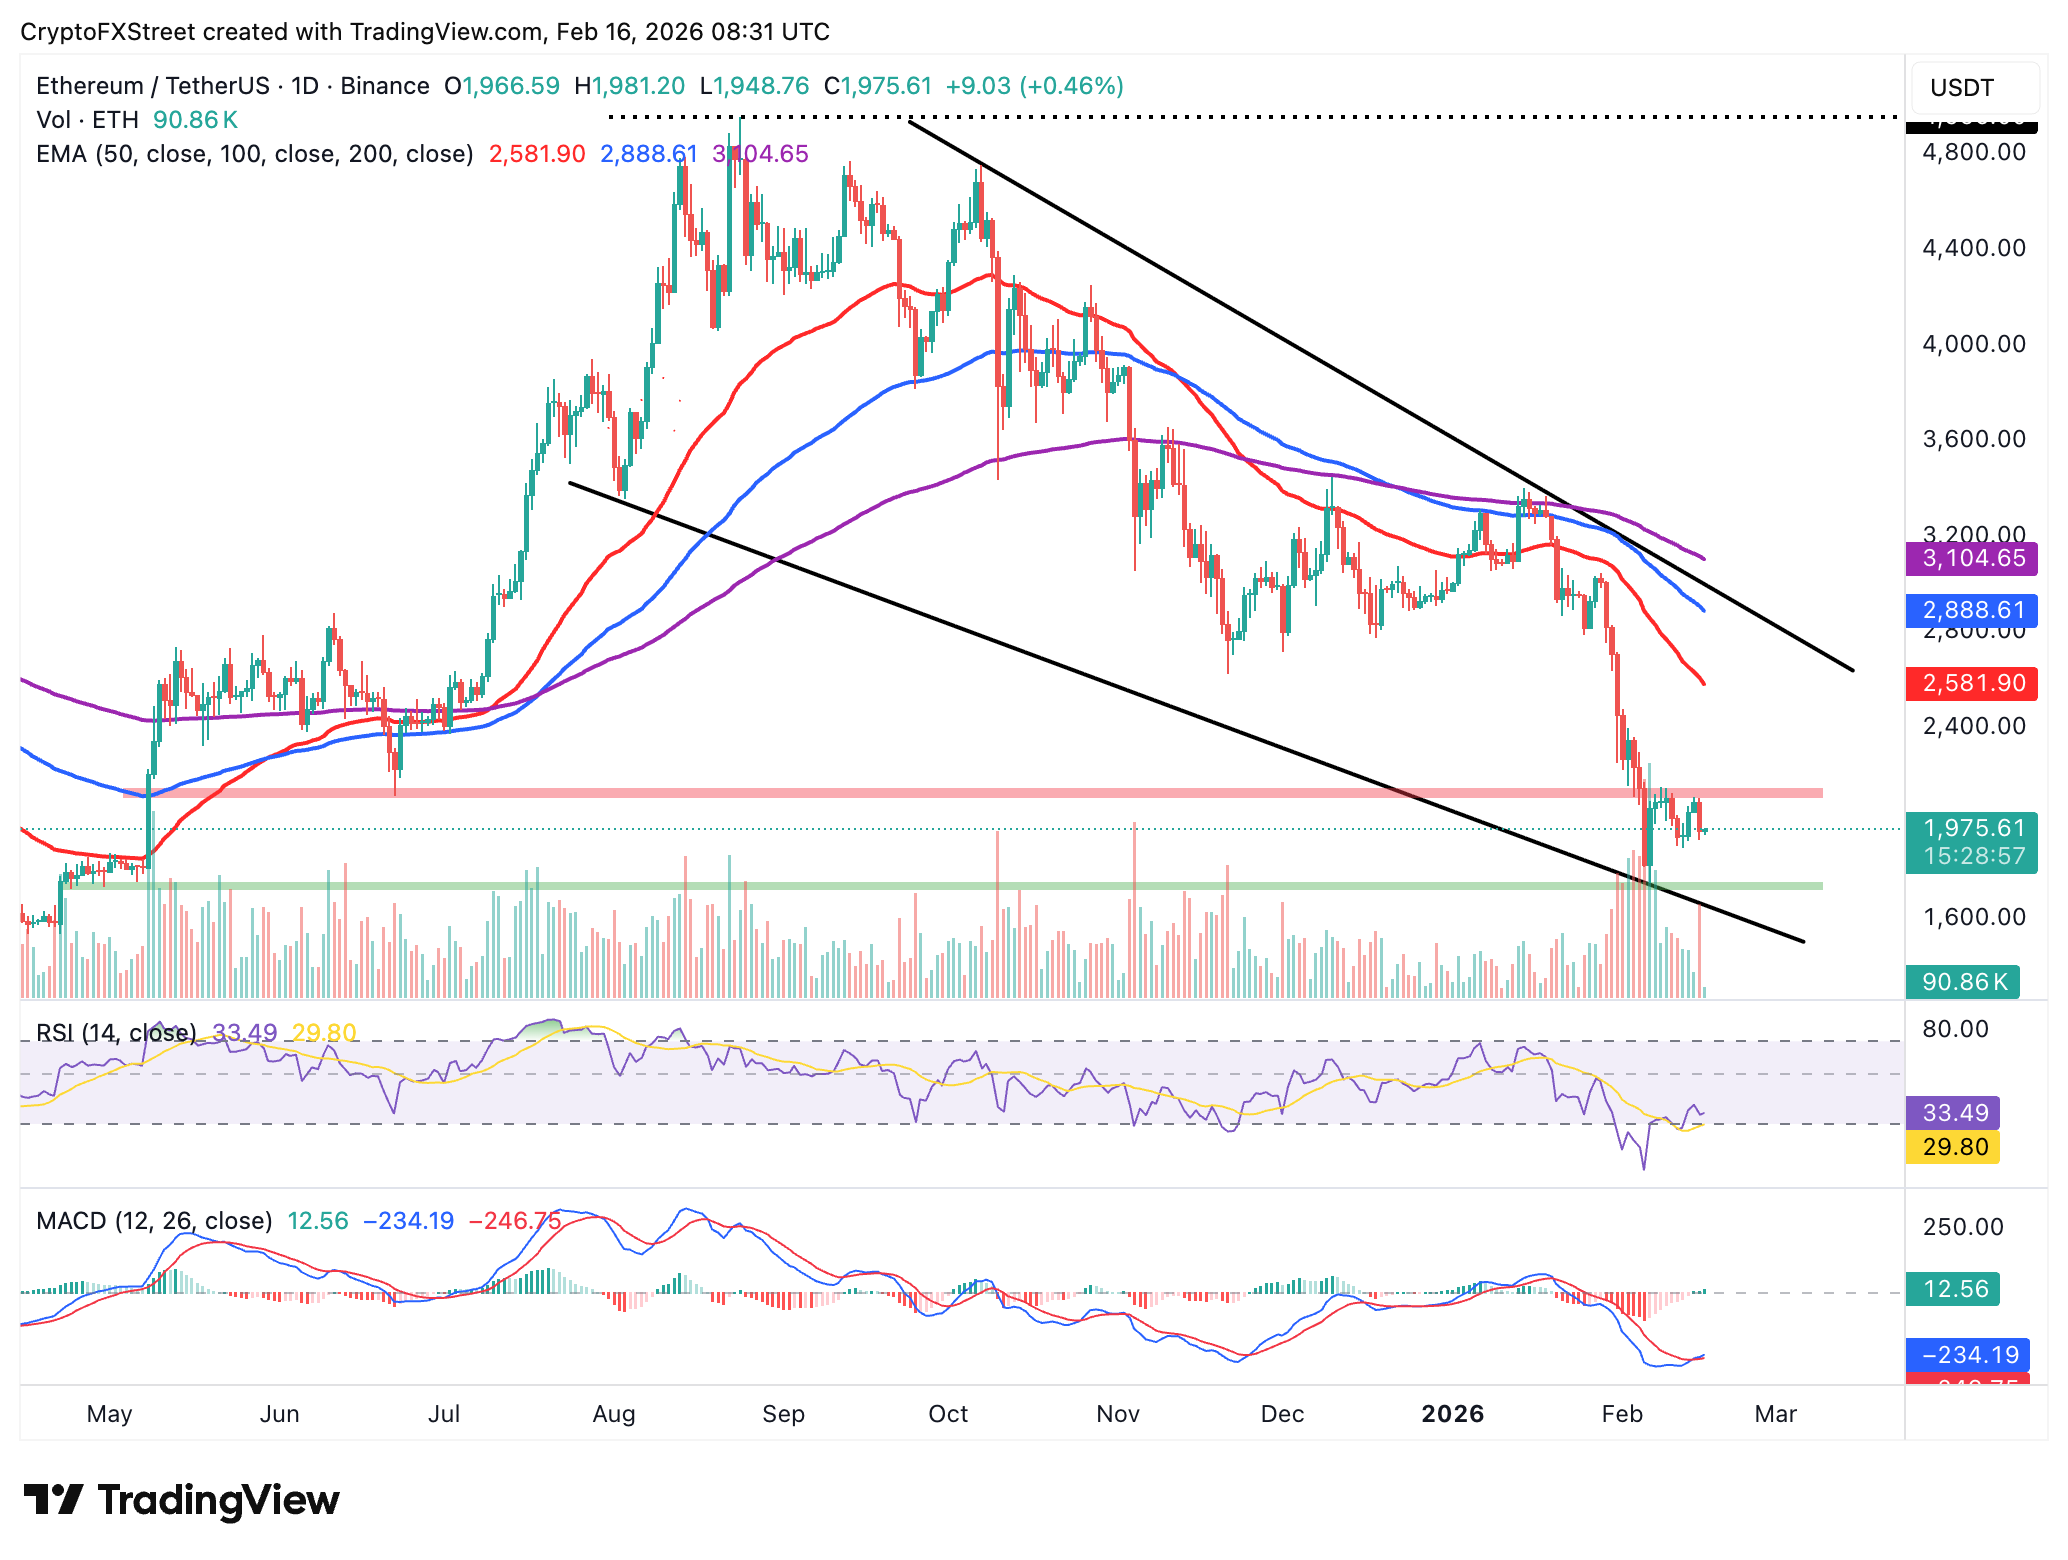
- Ethereum bulls defend $1,900 support from recent highs of $2,107 but weak derivatives remain in focus.
- XRP futures Open Interest increases to $2.56 billion but fails to improve sentiment as price falters around $1.46.
Bitcoin (BTC), Ethereum (ETH) and Ripple (XRP) continue to exhibit subdued volatility, consolidating within narrow ranges at the time of writing on Monday. Persistent low retail participation and weak technical structures limit the chances of any extended upside price movements.
As investors await a fresh catalyst, attention turns to the evolving macroeconomic environment. Last week’s Consumer Price Index (CPI) report showed that inflation eased in the United States in January, fuelling optimism for at least two rate cuts in 2026. Increasing chances of rate cuts tend to favor risk assets such as cryptocurrencies, but the overall risk-off tone in the market continues to weigh on them.
Bitcoin, Ethereum upside limited amid weak derivatives
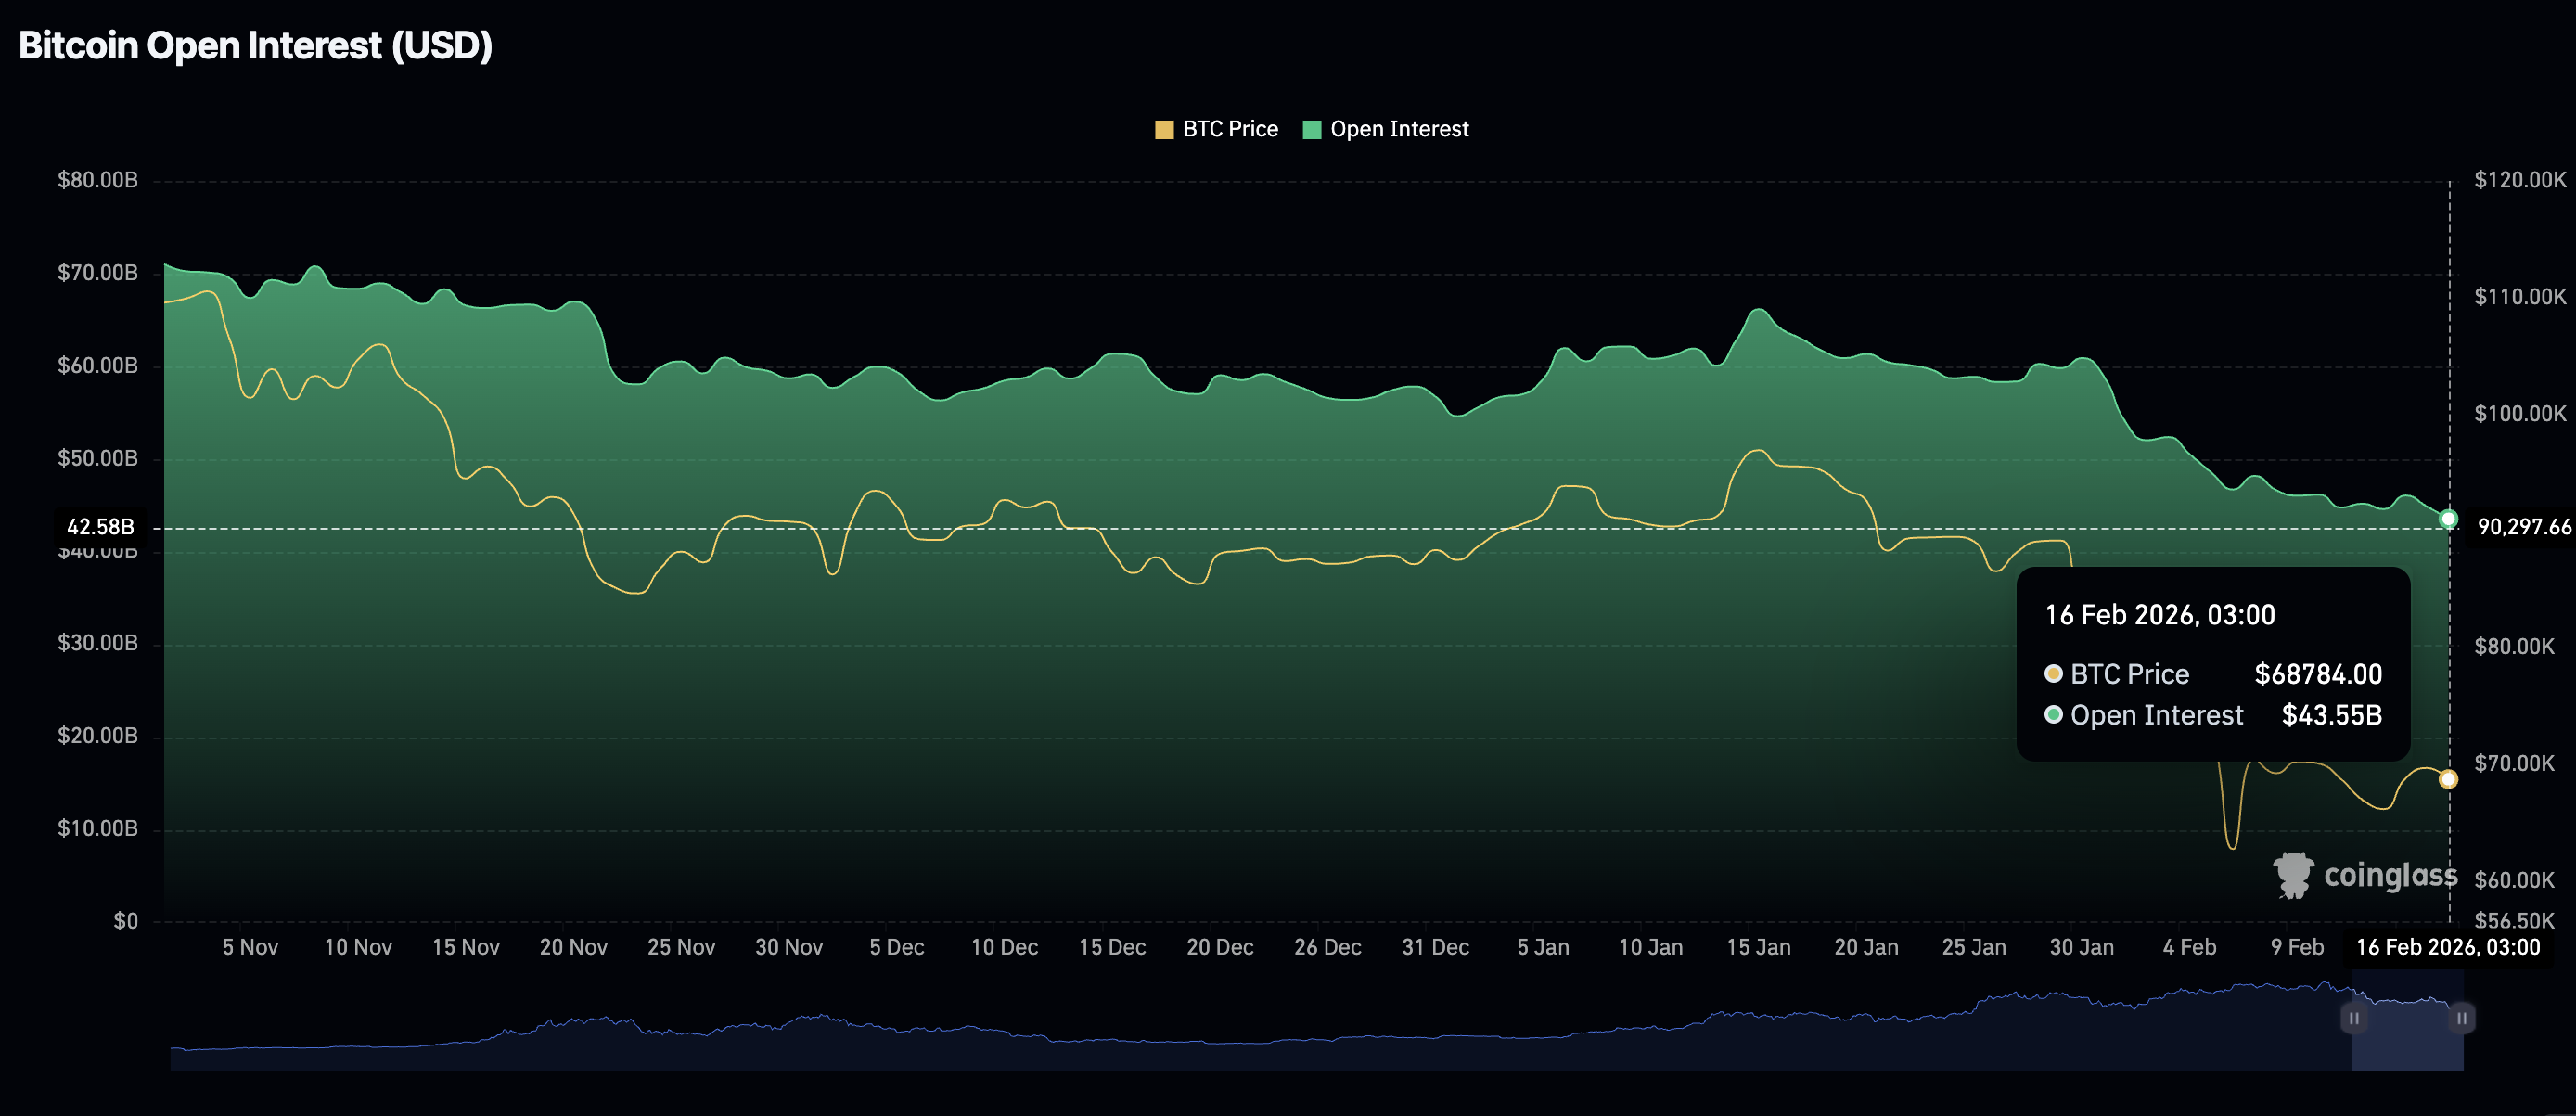
Bitcoin is trading amid weak conditions in the derivatives market, as futures Open Interest (OI) falls to $43.55 billion on Monday from $44.87 billion. Since Bitcoin hit a record high of $126,199 in October and an OI of $94.12 billion, retail investors have gradually lost interest, fuelling a persistent price decline.
Low retail activity suggests investors lack confidence in Bitcoin’s ability to sustain gains or extend the uptrend. Hence, they resolve to close positions rather than open new ones, leaving Bitcoin's price vulnerable to further downside.
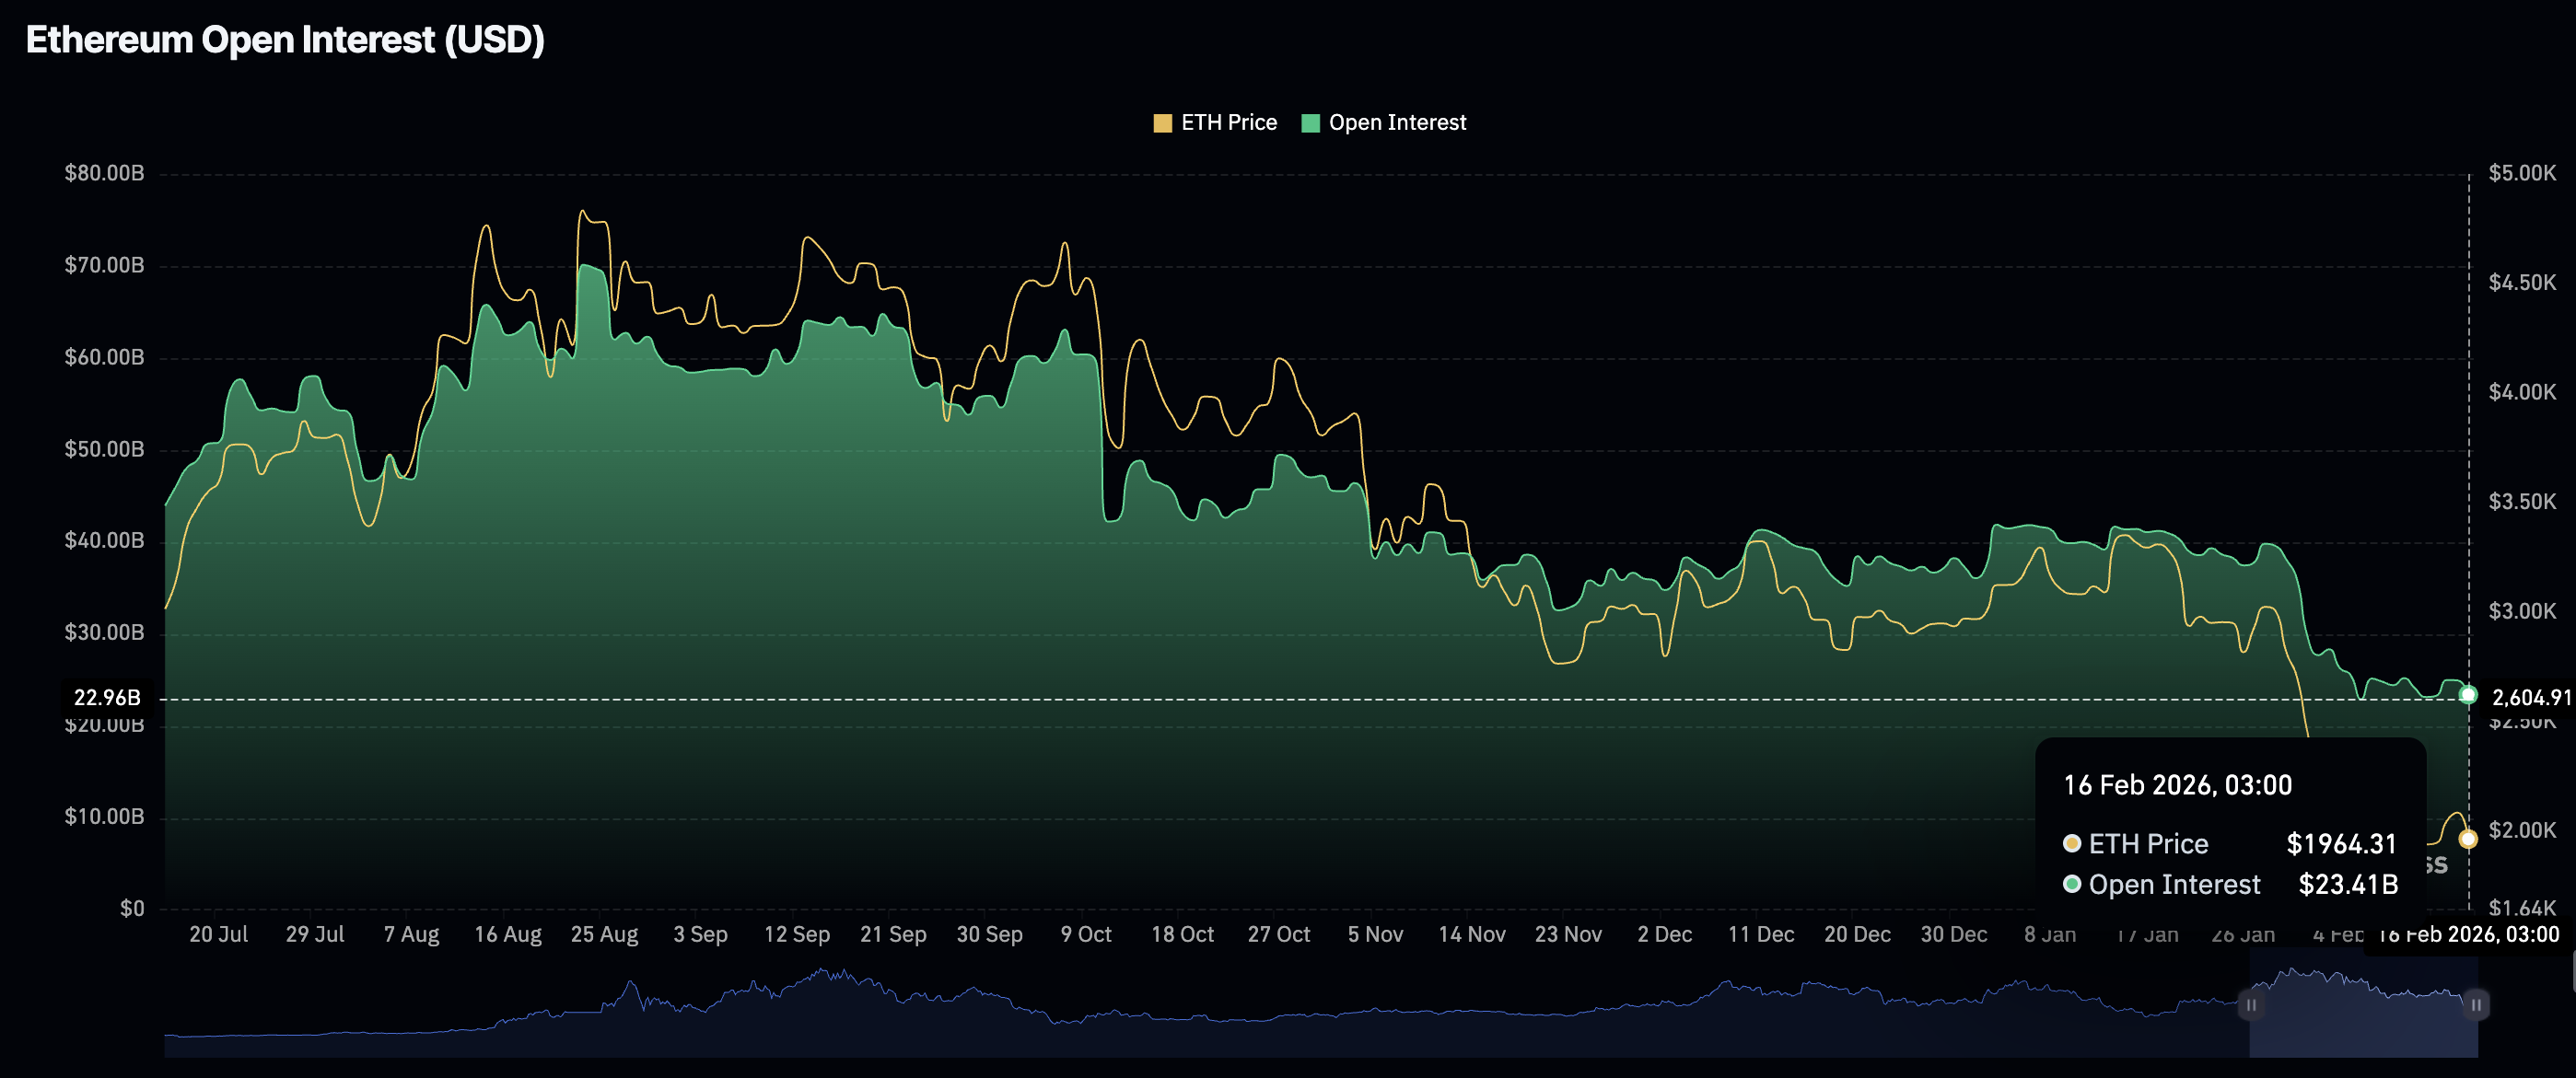
Ethereum also faces a weak derivatives market, with futures OI dropping to $23.41 billion on Monday from $24.96 billion the previous day. Despite Ethereum briefly trading above $2,000 last week, retail activity remained low, not enough to spark risk appetite.
Meanwhile, the XRP derivatives market paints a slightly different picture, with futures OI rising to $2.56 billion on Monday from $2.51 billion on Sunday. Retail interest has steadied since Friday, when OI averaged at $2.26 billion. Maintaining this positive trend could improve sentiment surrounding the token and stop the price decline.
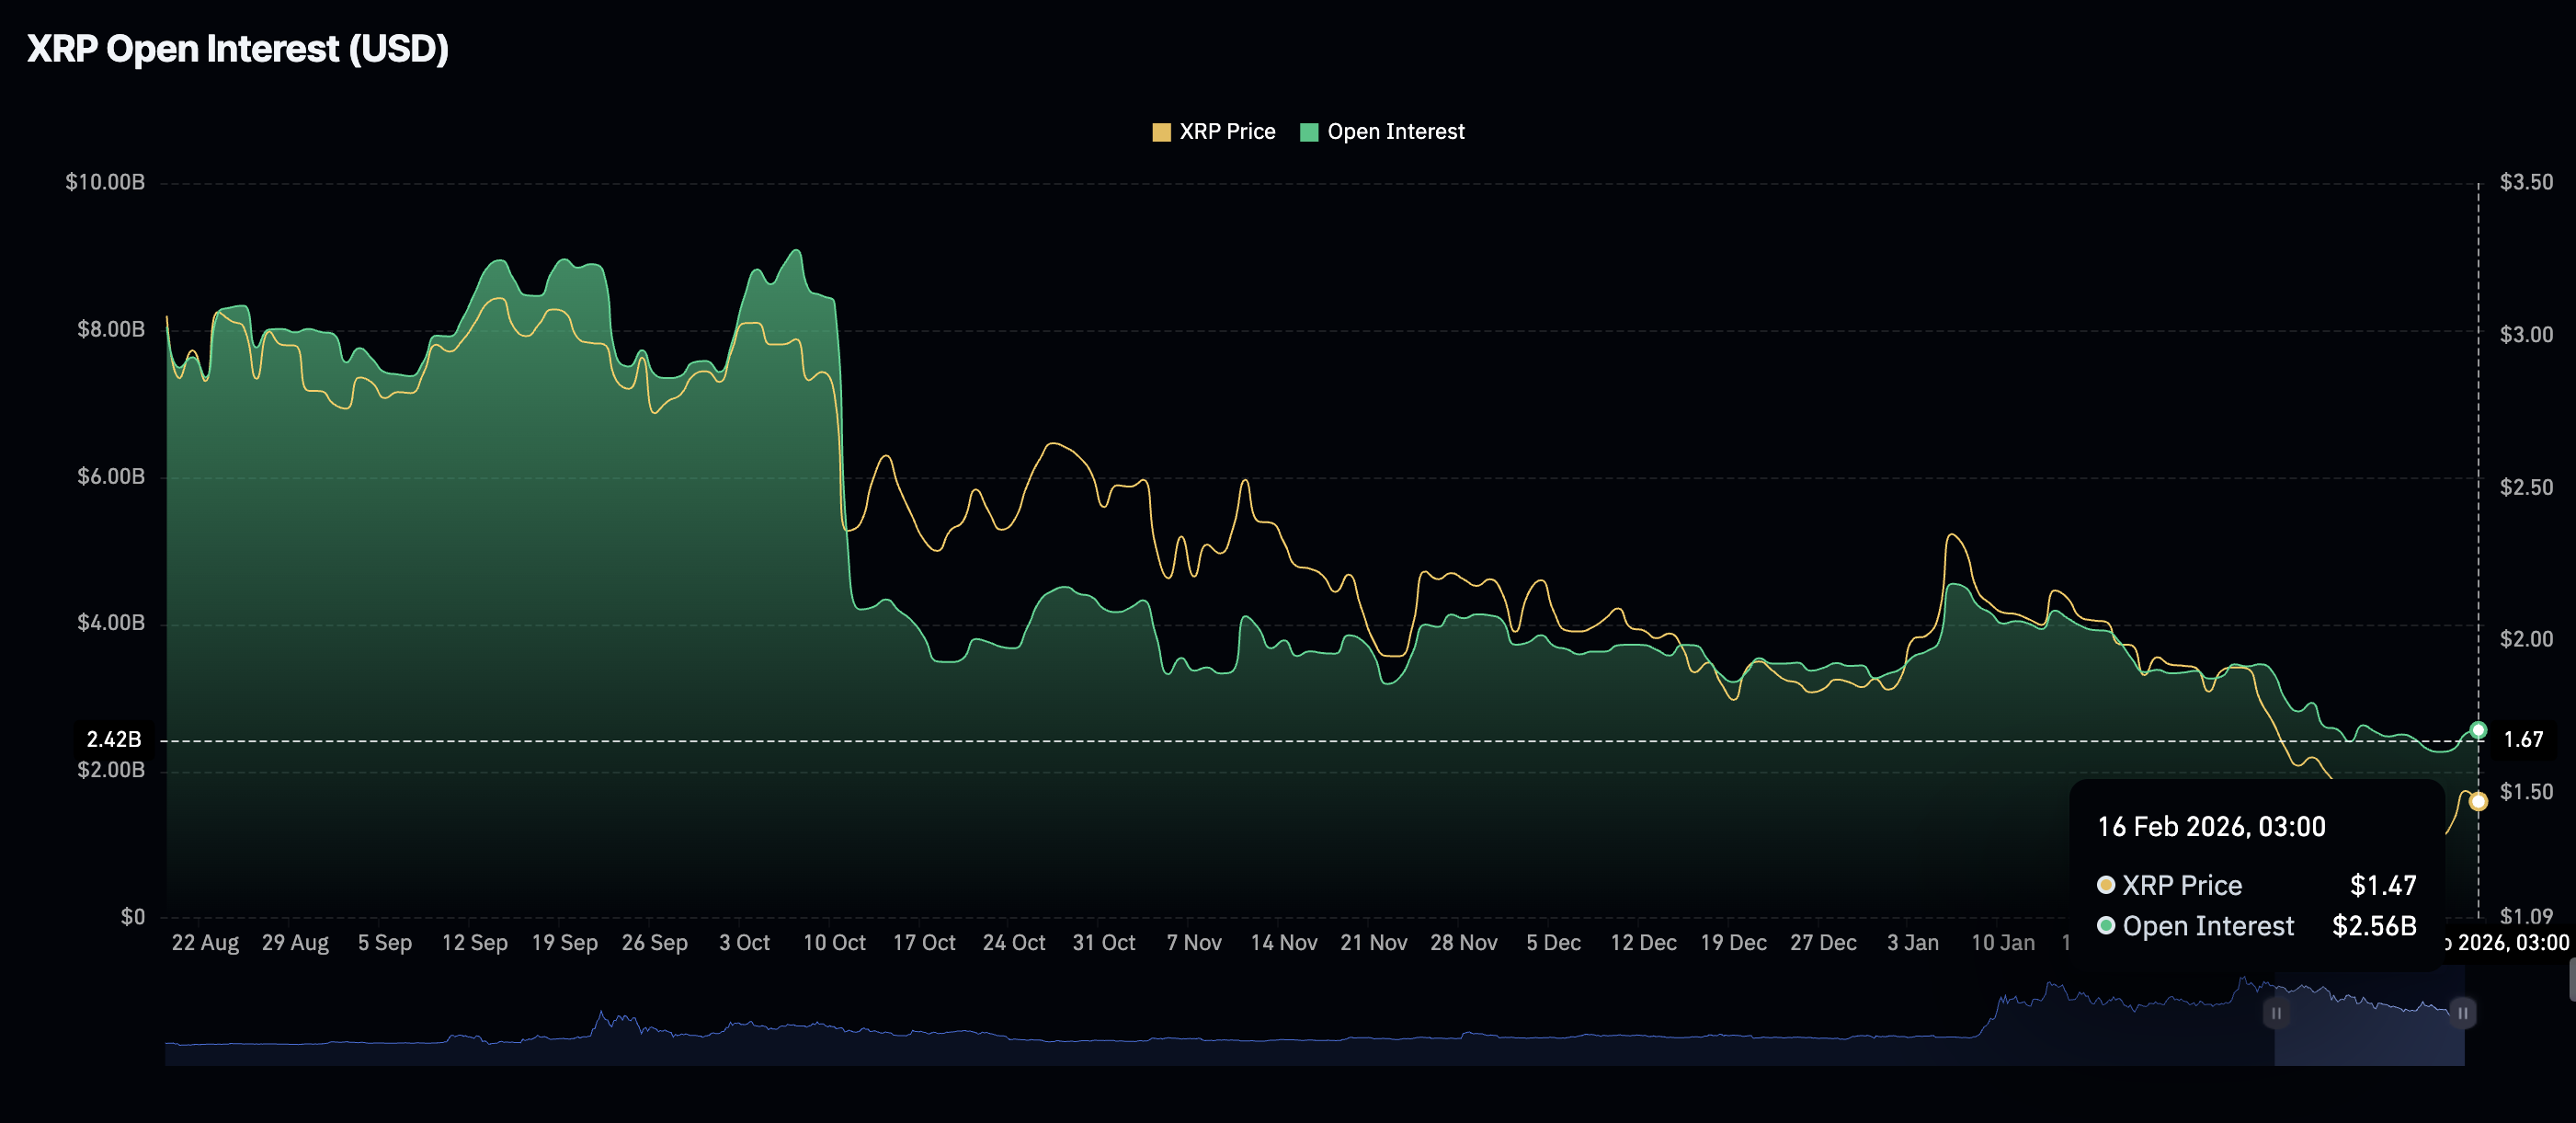
Chart of the day: Bitcoin consolidates as bulls eye short-term breakout
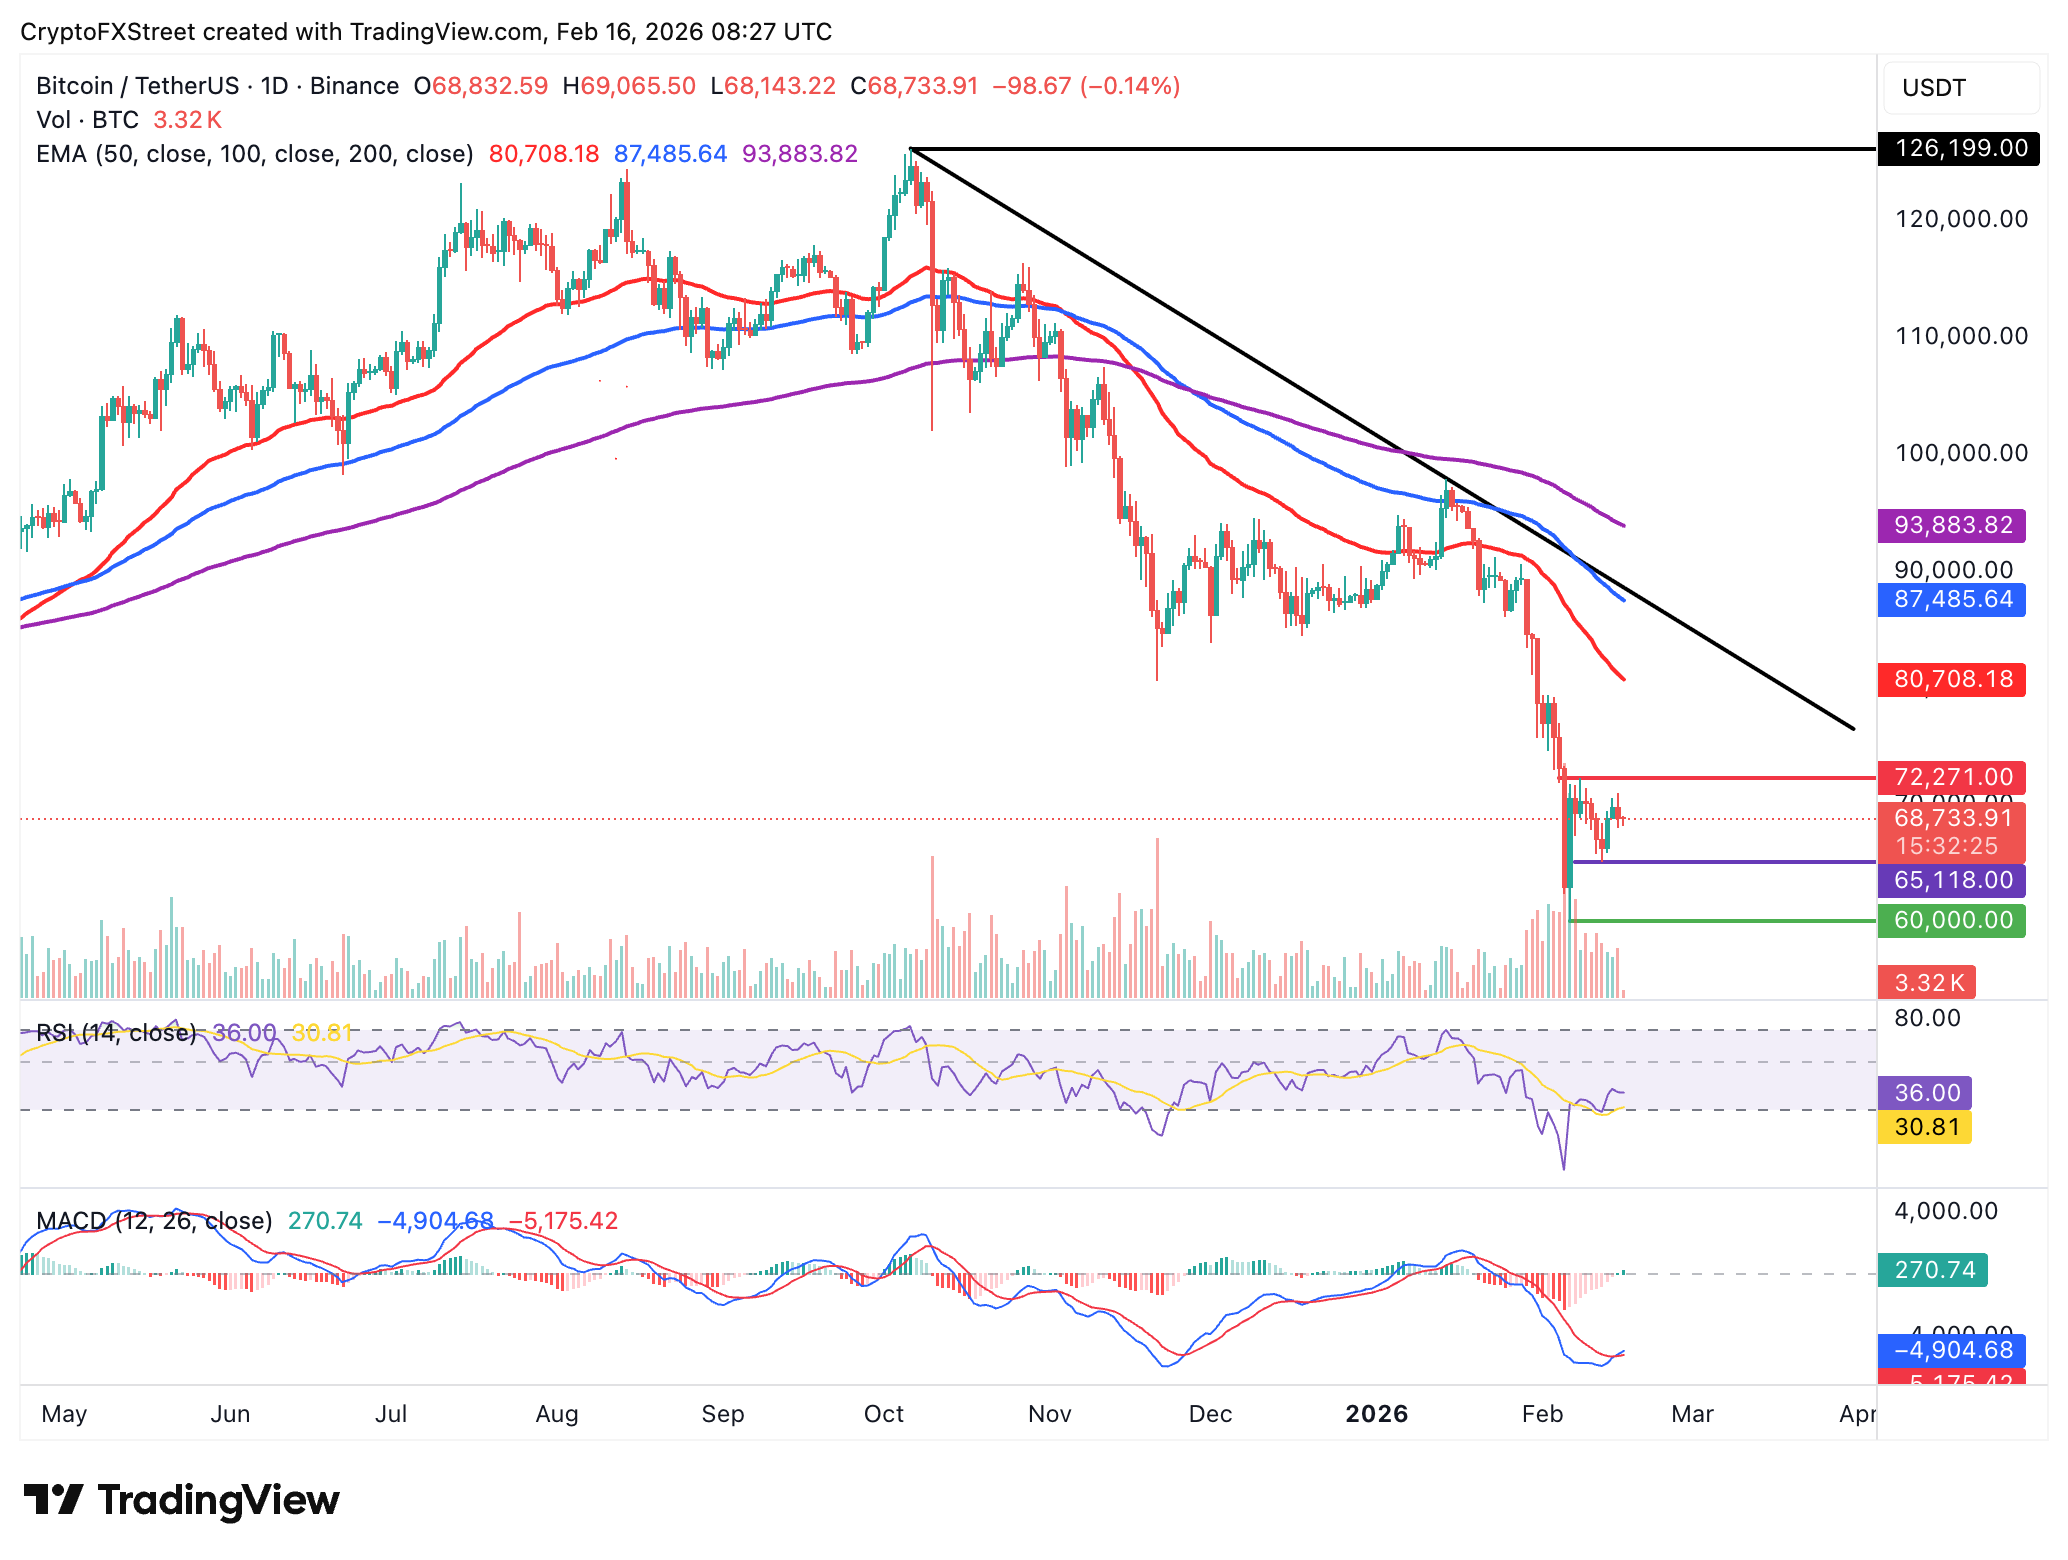
Bitcoin hovers above $68,000, aligning with the Relative Strength Index (RSI), which has stabilised at around 36 on the daily chart. A continued increase in the RSI toward the midline would support a short-term bullish outlook and increase the odds of Bitcoin steadying above $70,000.
The Moving Average Convergence Divergence (MACD) indicator holds above the signal line on the same chart, suggesting that momentum is shifting in favour of the bulls. Moreover, the green histogram bars are starting to expand above the zero line, prompting traders to increase exposure.
Still, Bitcoin remains below the 50-day Exponential Moving Average (EMA) at $80,718, the 100-day EMA at $87,491 and the 200-day EMA at $93,886. All three moving averages are sloping downwards, preserving the bearish outlook. If Bitcoin's price continues to fall, the first key support emerges at $65,118, the low from February 12.
Altcoins technical update: Ethereum, XRP hold key support levels
Ethereum trades near the $2,000 threshold after retesting a short-term support close to $1,900. The leading smart contract token’s recovery stalled at $2,107 on Saturday, reflecting the above-mentioned weak derivatives.
However, the subtle increase in the RSI to 34 on the daily chart hints that bulls are increasing their presence in the market. Higher RSI readings toward the midline would support a shift.
Similarly, the MACD has crossed above the signal line on the daily chart, backing the optimistic outlook. A steady increase toward the zero line as the green histogram bars expand would confirm that bulls have the upper hand and prompt traders to increase their risk exposure.
As for XRP, it is trading $1.48, well below the 50-day EMA at $1.73 , the 100-day EMA at $1.94 and the 200-day EMA at $2.14. All three moving averages slope lower above XRP price, preserving a bearish bias.
The MACD line has crossed into positive territory above its signal line, and the expanding positive histogram bars suggest improving upside momentum. Meanwhile, the RSI at 43 remains below the midline, tempering the nascent recovery.
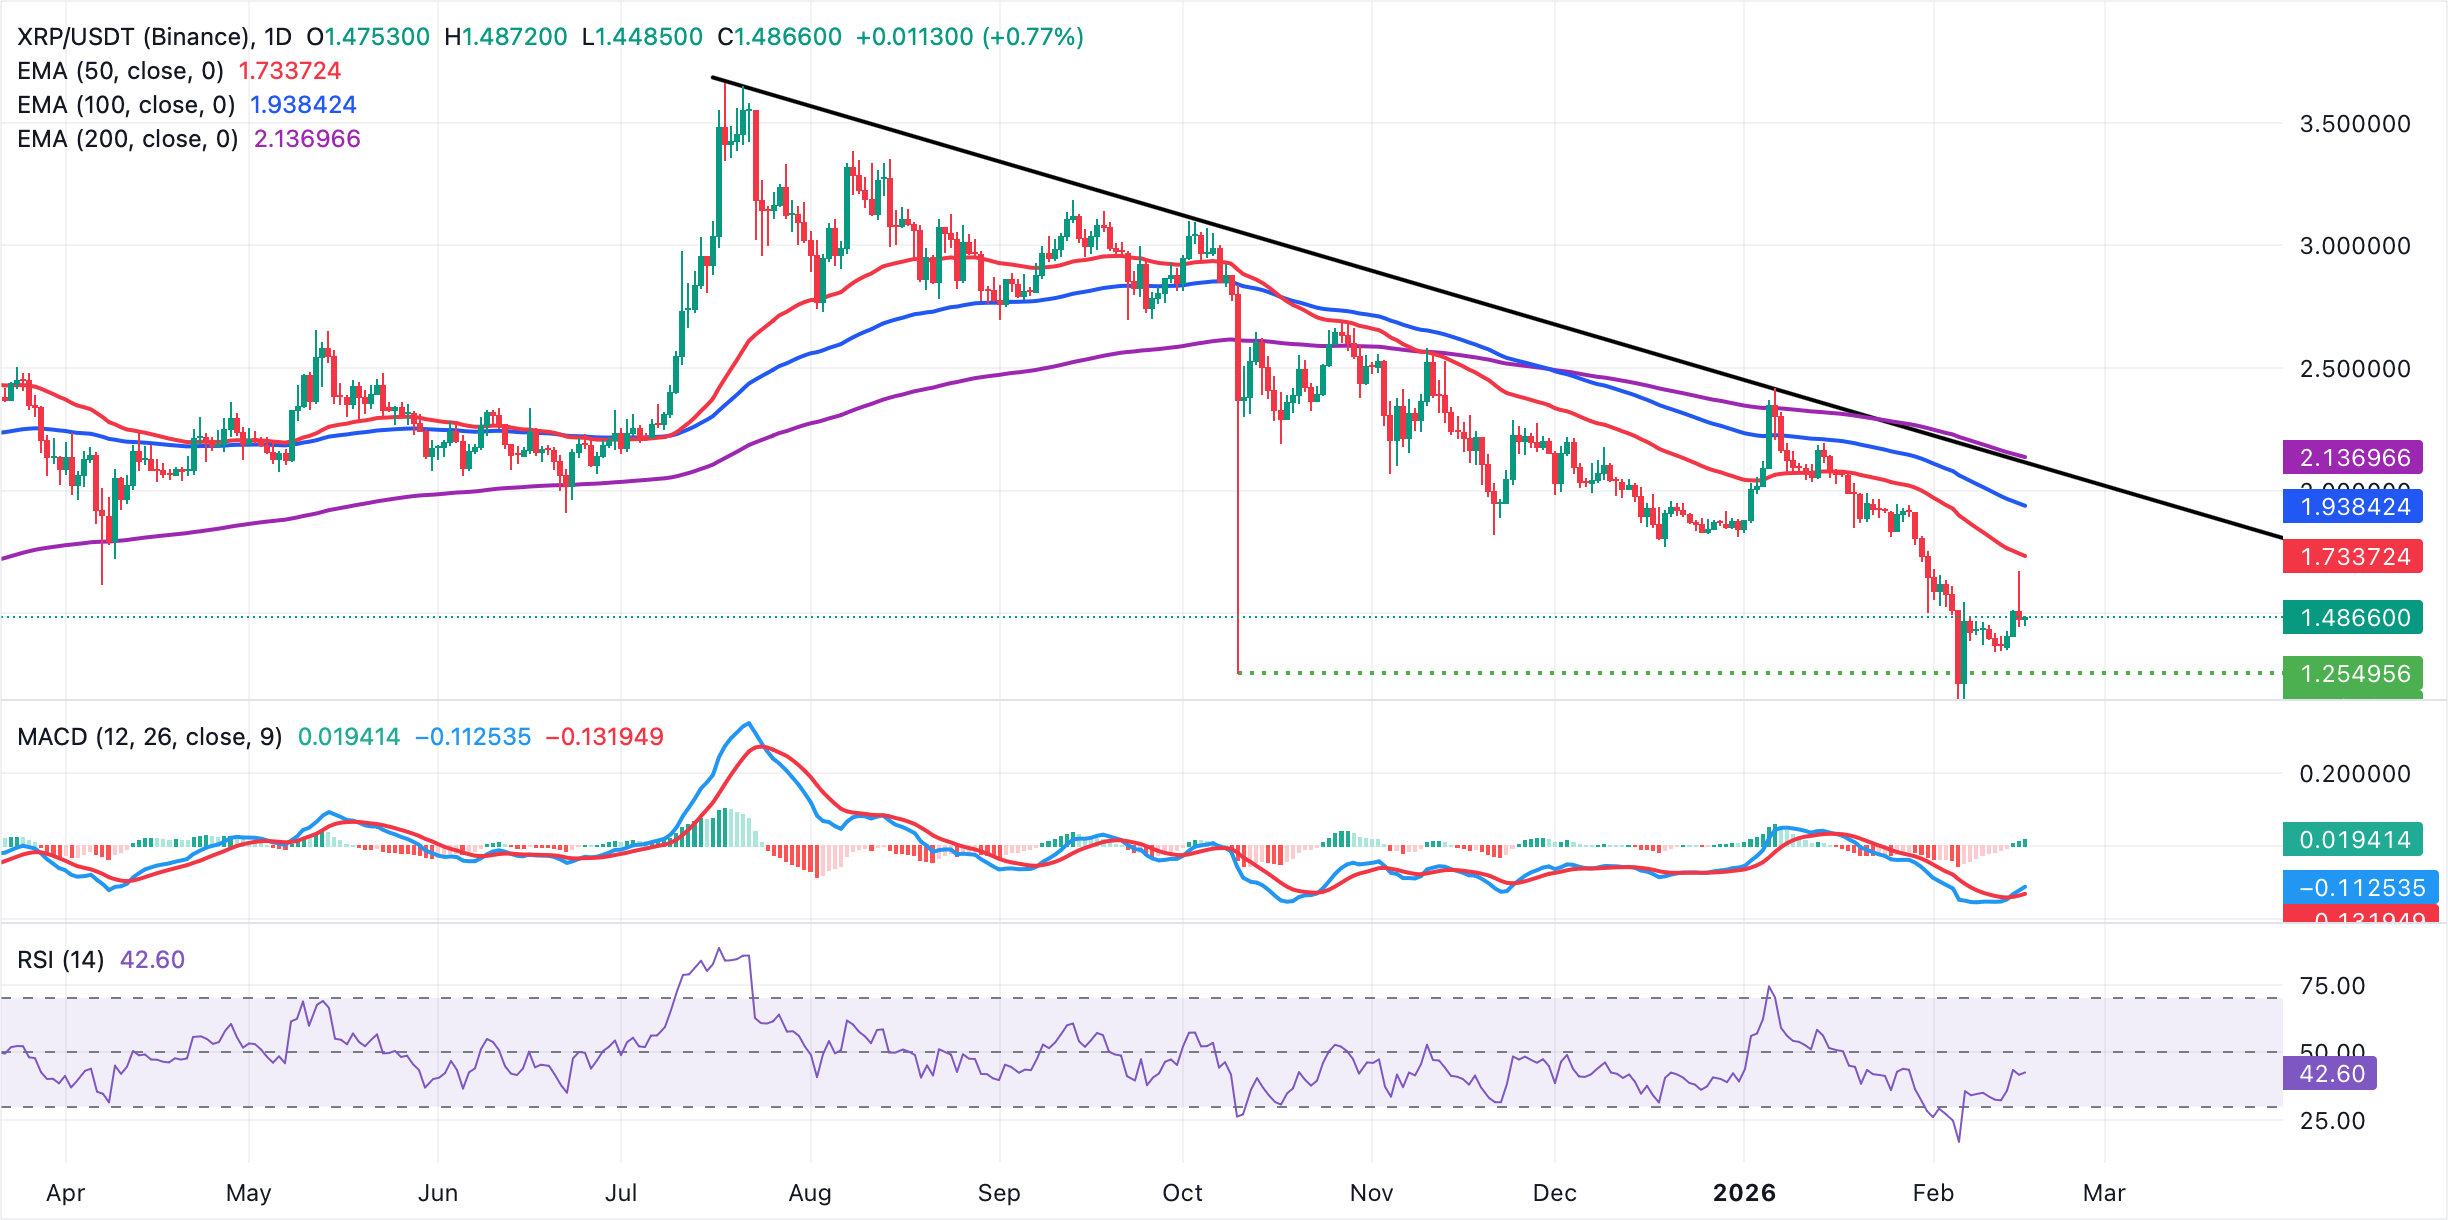
Still, the descending trend line from $3.68 limits advances, with resistance near $2.11. Above it, the 200-day EMA at $2.14 presents an additional hurdle. A daily close above the trend barrier would encourage a broader base-building phase, whereas failure to retake the 50-day EMA at $1.77 would keep the downtrend intact.
Open Interest, funding rate FAQs
Higher Open Interest is associated with higher liquidity and new capital inflow to the market. This is considered the equivalent of increase in efficiency and the ongoing trend continues. When Open Interest decreases, it is considered a sign of liquidation in the market, investors are leaving and the overall demand for an asset is on a decline, fueling a bearish sentiment among investors.
Funding fees bridge the difference between spot prices and prices of futures contracts of an asset by increasing liquidation risks faced by traders. A consistently high and positive funding rate implies there is a bullish sentiment among market participants and there is an expectation of a price hike. A consistently negative funding rate for an asset implies a bearish sentiment, indicating that traders expect the cryptocurrency’s price to fall and a bearish trend reversal is likely to occur.
(The technical analysis of this story was written with the help of an AI tool.)