Monero Price Forecast: XMR risks a drop below $300 under mounting bearish pressure

- Monero is approaching the $300 mark, down 4% so far on Monday, extending the decline from the previous day.
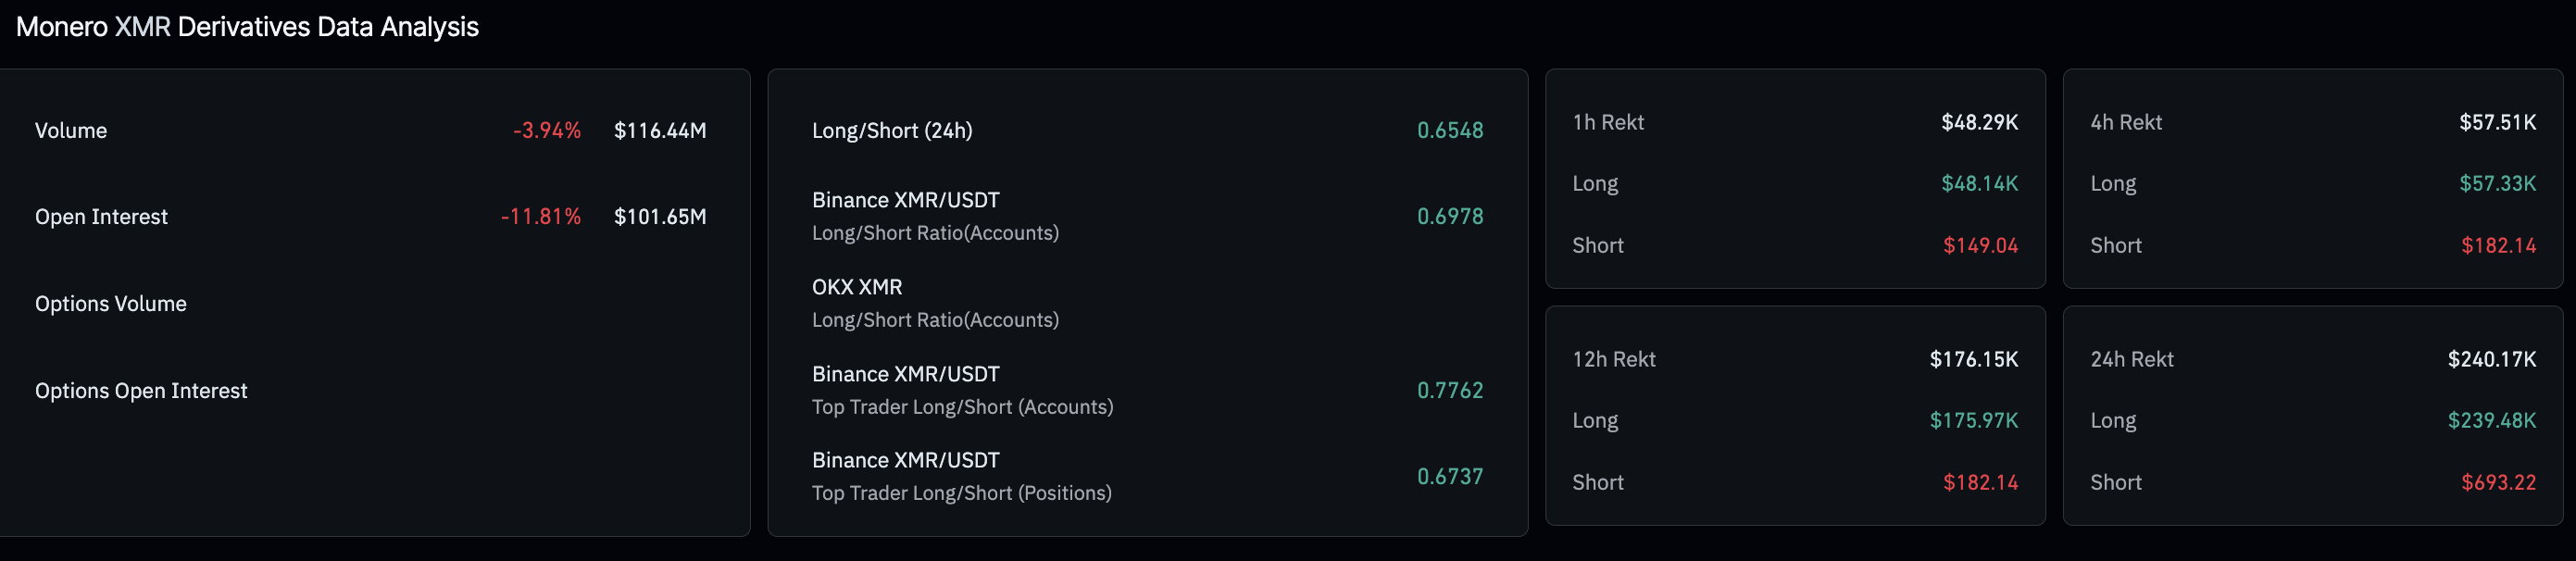
- Derivatives data indicate a bearish sentiment among traders, consistent with $240,000 long liquidations over the last 24 hours.
- The technical outlook for Monero is bearish, eyeing the crucial support zone near $300.
Monero (XMR) starts the week under pressure, recording a 4% decline at press time on Monday after a 7% drop the previous day, putting the $300 support zone in focus. The privacy coin is losing retail strength, with the recent slide wiping out roughly $240,000 in Monero derivatives over the last 24 hours. The technical outlook indicates downside risk, with a lower leg potentially crossing below $300.
Monero bulls lose strength amid mounting pressure
Monero bulls are under extreme pressure, as CoinGlass data show long liquidations totaling $239,480, significantly higher than short liquidations of $693.22 over the last 24 hours. This indicates a primarily long-side-focused wipeout driven by declining XMR spot prices.
The XMR futures Open Interest (OI) stands at $101.65 million on Monday, recording more than 11% decline in the last 24 hours amid increased long-side liquidations. Additionally, the liquidations lead to sell-side dominance in XMR derivatives, with the long-to-short ratio dropping to 0.6548, indicating the greater number of active short positions.
How low will Monero go?
Monero peaked at $364 last week, but a 7% drop brought the closing price to $331 on Sunday, capping weekly gains at just under 4%. At the time of writing, Monero is down 4% on Monday and remains below the 50-day and 200-day Exponential Moving Averages (EMAs), indicating a short-term bearish bias. The privacy coin is inching closer to the 78.6% Fibonacci retracement level at $302, drawn from the August 15 low at $231 to the January 14 high at $800.
Additionally, a support zone between $290 and $302 could absorb incoming supply pressure. A decisive close below this zone could extend the XMR decline to $231.
The technical indicators on the daily chart flash downside risk as sellers retain trend control. The Relative Strength Index (RSI) is at 35, retracing toward the oversold zone after a minor recovery last week, indicating renewed selling pressure and further downside before reaching the oversold zone. The Moving Average Convergence Divergence (MACD) and the signal line remain flat after Friday's crossover, in negative territory, indicating a neutral-to-bearish stance.
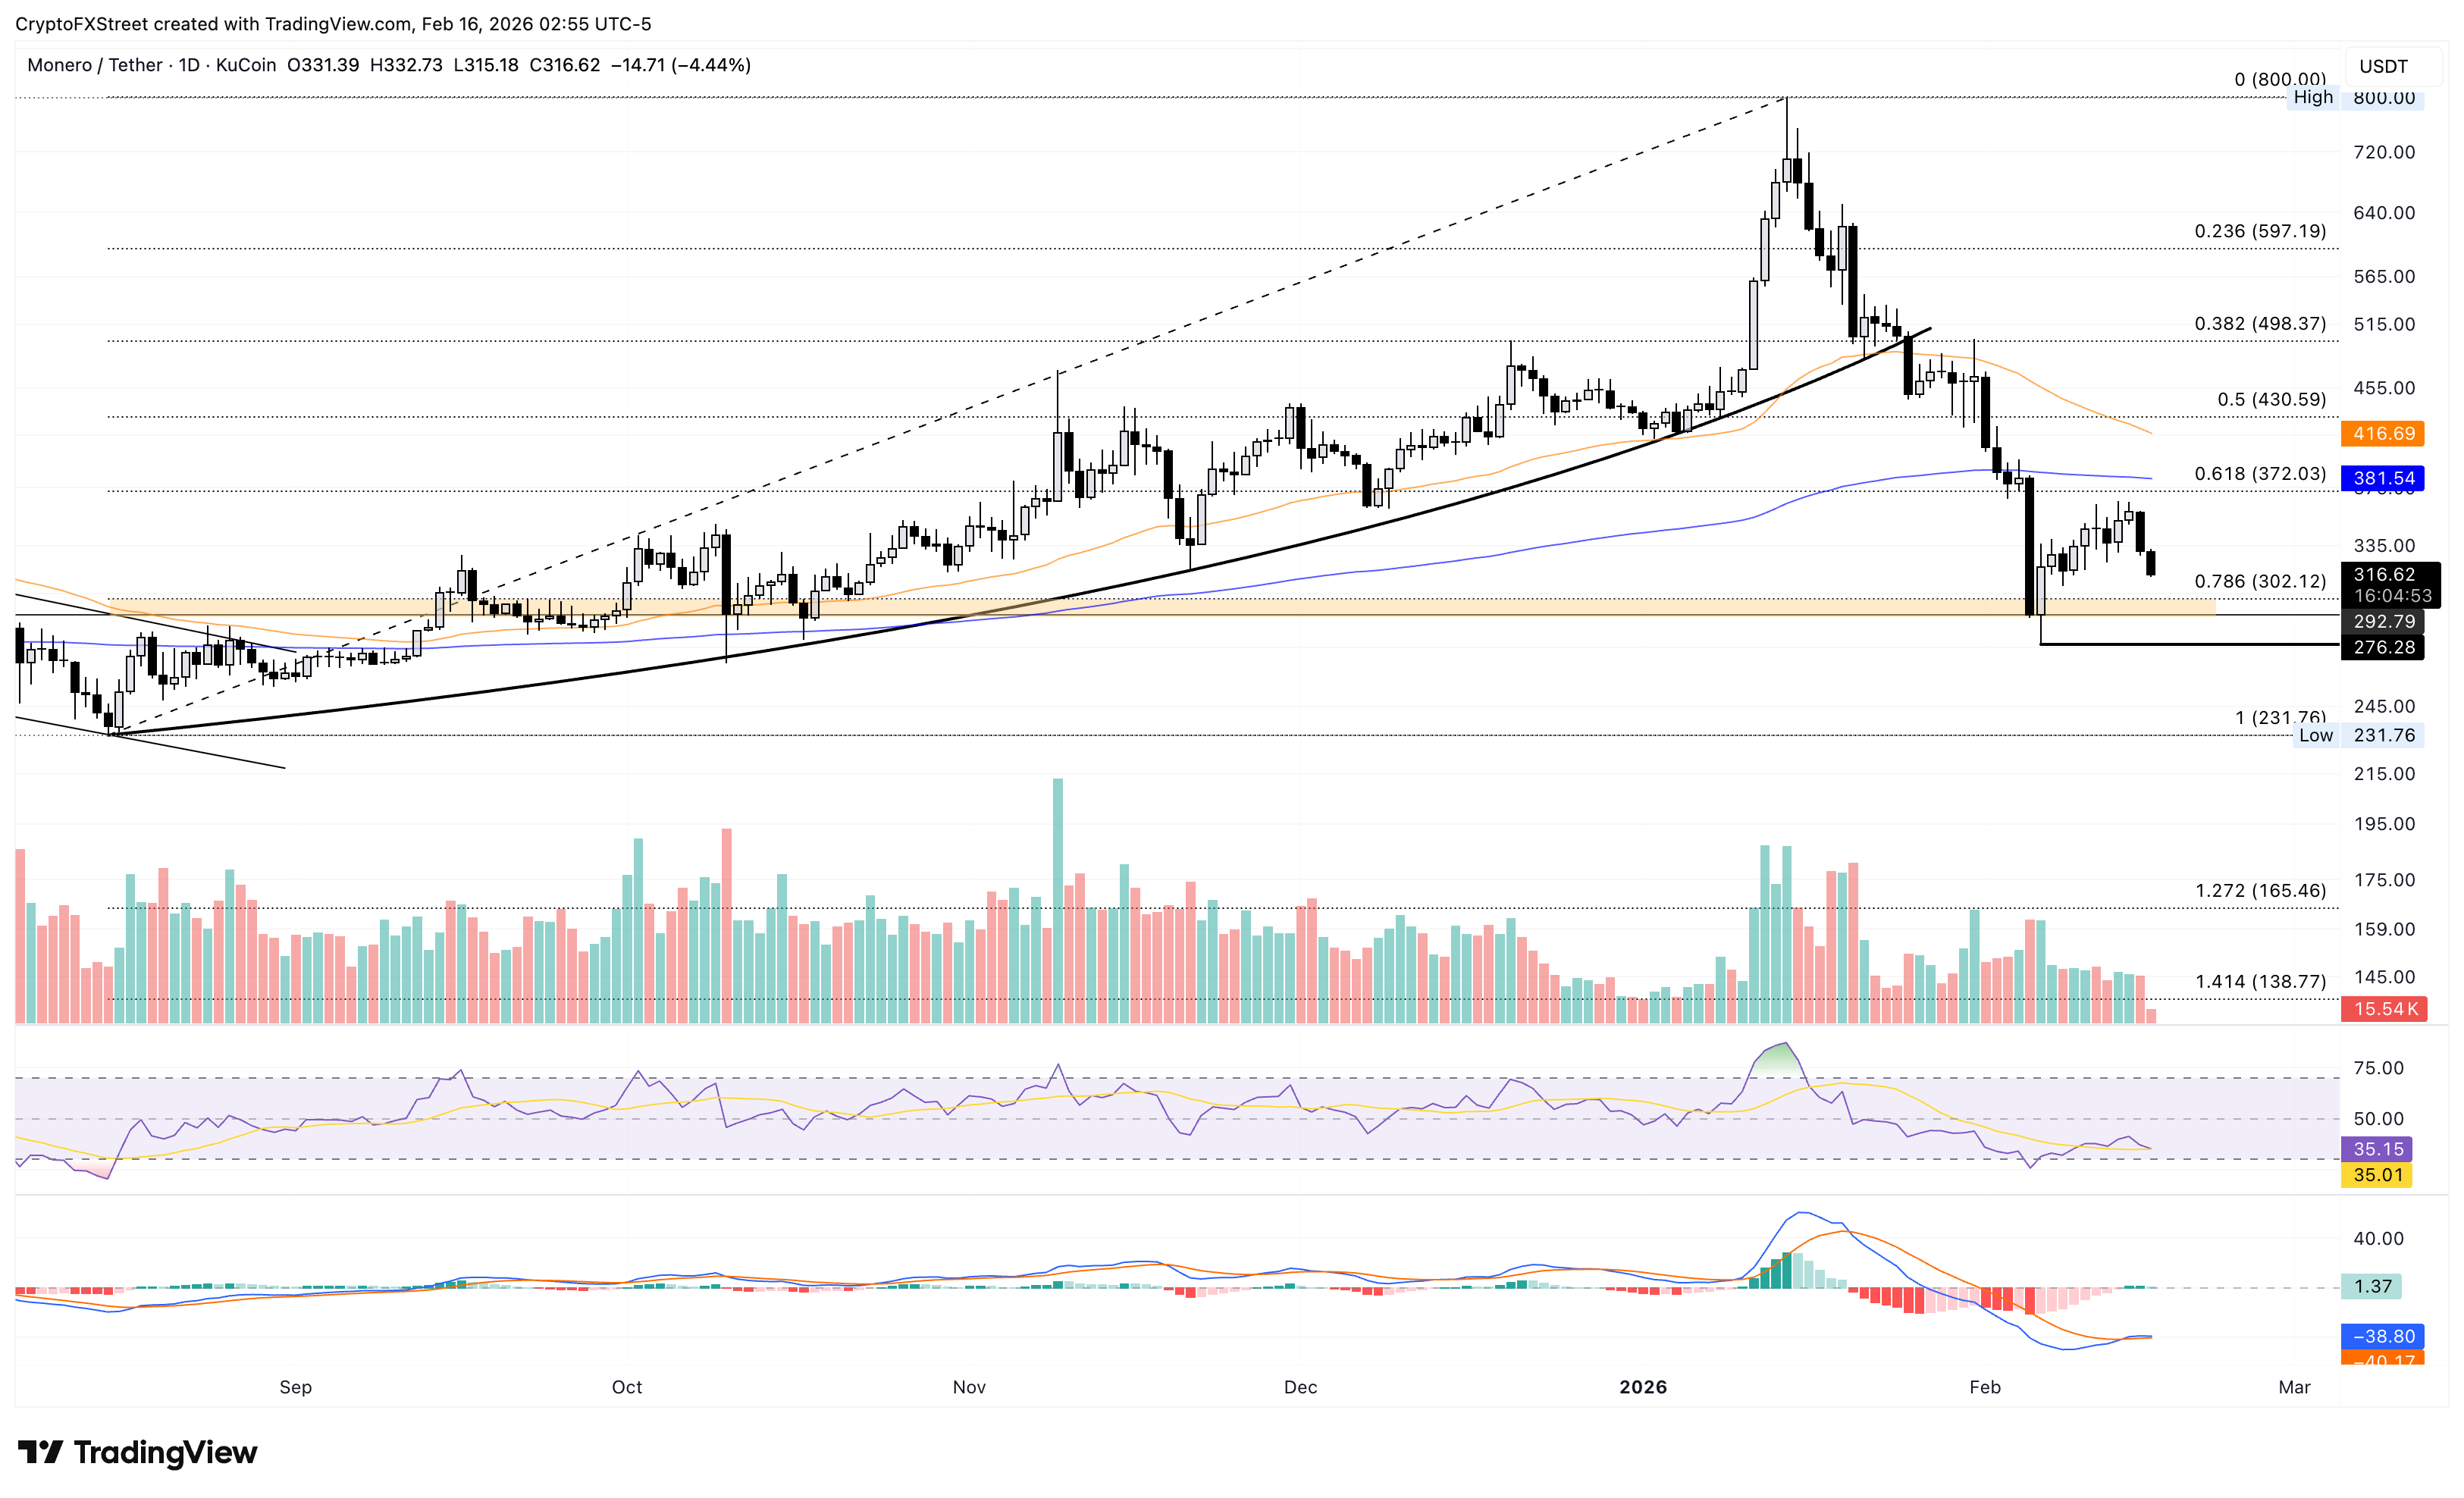
Looking up, a rebound in Monero should exceed the range between the 38.2% Fibonacci retracement level at $372 and the 200-day EMA at $381 for a sustained recovery. If this happens, it could target the 50-day EMA at $416, followed by the 50% Fibonacci retracement level at $430.