DeFi platforms Ethena and Polygon eye recovery after sustained downturn

- Ethena faces resistance near the 20-day EMA, with huge losses suggesting prices may have bottomed.
- The token has maintained a TVL above $7 billion since the beginning of the year, despite prices crashing heavily.
- Polygon has registered a nearly 10% gain, with its steady TVL positioning it for a recovery above the 20-day EMA.
Ethena (ENA) is trading around $0.116 on Friday, posting a 6% rise earlier before tapering some of those gains over the past 24 hours.
The move comes as ENA investors are down by an average of about 70%. The huge unrealized losses could indicate that current price levels represent a bottom or less downside risk, per Santiment data.
 [05-1770956673671-1770956673673.23.54, 13 Feb, 2026].png)
Meanwhile, Ethena's total value locked (TVL) has grown slightly above $7 billion since the beginning of the year, despite prices crashing, per DefiLlama data.
In the daily chart, the 20-day Exponential Moving Average (EMA) at $0.138 slopes lower and caps rebounds, keeping the short-term trend under pressure. Price remains beneath this gauge, and sustained closes below it preserve a bearish bias. Support is seen at $0.101, with resistance at $0.262 and $0.468.
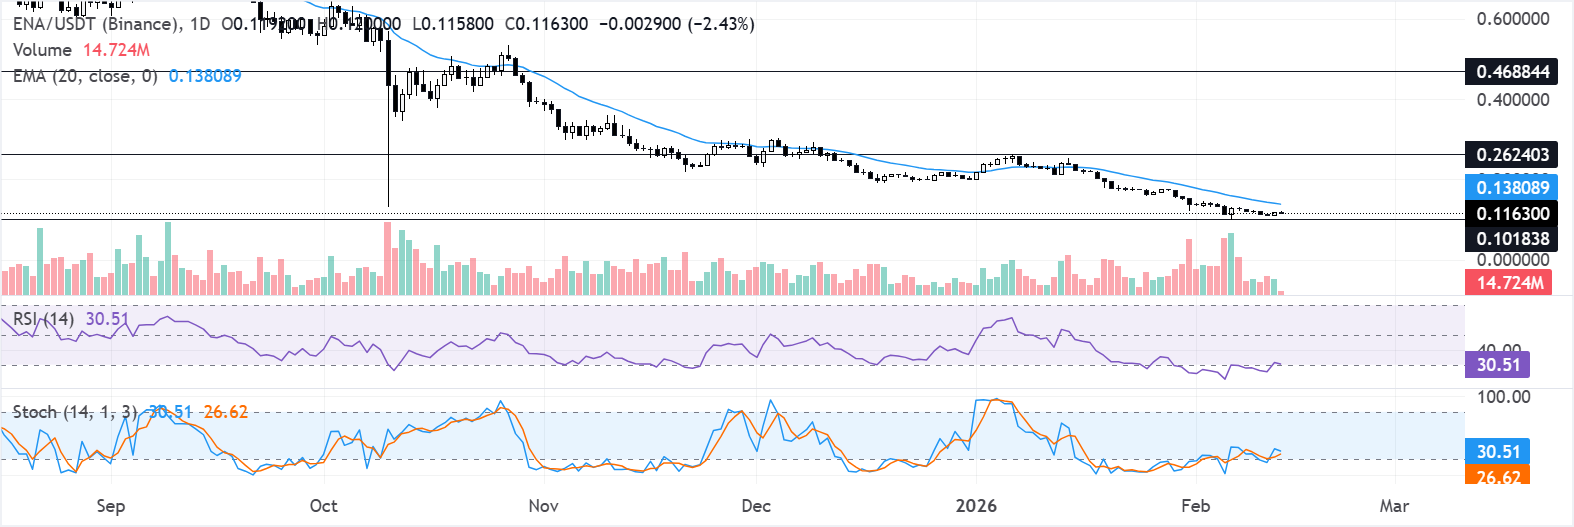
The Relative Strength Index (RSI) at 30 (near oversold) reflects subdued momentum with limited follow-through on bounces. The Stochastic (Stoch) near 31 shows tentative stabilization after prior extremes. A recovery above the 20-day EMA could ease selling pressure and open the door to a broader consolidation. Failure to reclaim it would keep downside risk intact.
POL sees 10% gain, eyes recovery above 20-day EMA
Polygon (POL) is up nearly 10% over the past 24 hours as of writing. However, the token remains down nearly 50% from its yearly peak of $0.184 on January 11.
Despite the large price drop, Polygon's TVL has held steady above $1 billion over the past month, meaning capital isn't leaving the chain, according to DefiLlama data.
Loss realization also spiked slightly over the past week, climbing to about $40 million, per Santiment data.
In the daily chart, POL/USDT trades at $0.097. The 20-day EMA at $0.104 slopes lower and caps recovery attempts, keeping the short-term trend under pressure. Price remains below this average, which continues to restrain rallies. The RSI at 41, below the midline, reflects subdued momentum, while the Stoch near 40 has turned higher, hinting at tentative stabilization. Immediate resistance aligns at $0.168, while support is seen at $0.088.
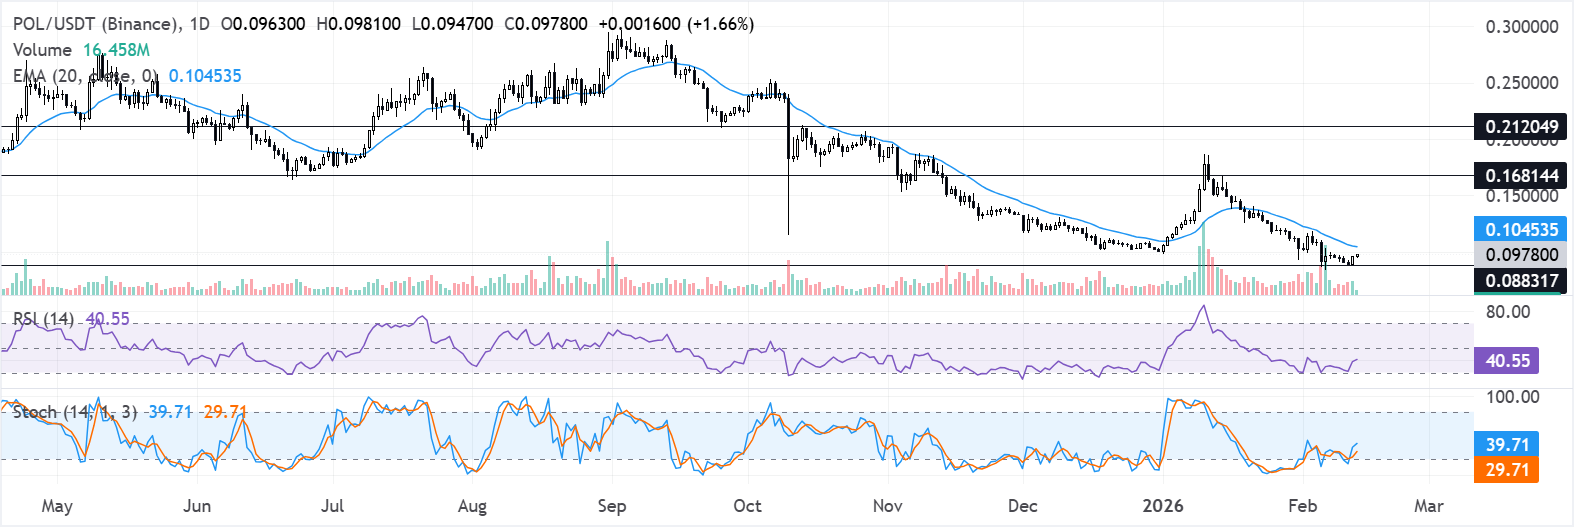
Momentum shows early improvement as the RSI and Stoch curl higher, but confirmation would require a daily close above the 20-day EMA to shift bias. A break above $0.168 could pave the way toward the next barrier at $0.212. Failure to reclaim the EMA would keep the downside favored, leaving rebounds shallow.
(The technical analysis of this story was written with the help of an AI tool.)
Related Articles
This $1 Trillion AI Stock Is Getting Ready for 2026: Is Meta a Good Buy?
When ads and commerce are factored in, Meta is building a long-term platform—in Augmented Reality and smart glasses — to get us closer to the future of AI. This device hardware business is less profitable than ads right now, but it could grow the company’s ecosystem and open up new ways for it to ma
Is SaaS Dead? The Truth Behind the Software Meltdown, the Missing Floor, and the Peak That’s Not Coming Back
TradingKey - A trillion dollars just vanished from software stocks—this piece breaks down who AI is really killing, who quietly benefits, and why cheap SaaS may be the biggest value trap of this cycle.
Best AI Tools for Stock Analysis in 2026 to Boost Your Investment Portfolio
As Artificial Intelligence (AI) continues to enhance everyday decision-making, these tools will allow us to leverage artificial intelligence to analyse stocks and optimise our investment portfolio.
Silver Faces Sixth Consecutive Year of Supply Deficit, How Much Upside Is Left in 2026?
TradingKey - According to the 2026 Silver Market Outlook recently released by the Silver Institute, the current robust performance of the silver market remains supported by solid fundamentals. The report indicates that the global silver market is expected to face a structural supply-demand imbalance