

Analyst Outlines The Bull Case For XRP And Why Price Will Hit All-Time High Soon

XRP is now back to trading just above the $2 level after an early January rally briefly carried its price action into the $2.40 range. The pullback has so far been controlled, with price holding above former resistance that has now turned into short-term support.
A technical analysis shared on X by crypto analyst Bird proposed that conditions are now right for a familiar macro setup that has preceded XRP’s largest historical rallies. The focus of this outlook is on XRP’s reaction with the US dollar index and what its next move could mean for the cryptocurrency.
How DXY Weakness Has Always Unlocked XRP Rallies
Bird’s analysis is based on the US Dollar Index, or DXY, and its inverse relationship with XRP during important phases. The chart accompanying his post pointed to three previous periods, around 2017, 2021, and 2024, where sustained weakness in the dollar coincided with aggressive upside moves in XRP.
In each of those cycles, red candles on the DXY chart led to a loss of dollar strength, while XRP responded with strong upward expansion shortly after. This recurring pattern means that XRP’s largest moves tend to follow macro shifts, not just even events related to XRP. When dollar dominance fades, capital always rotates into crypto assets, and XRP has been one of the primary beneficiaries of that transition.
Interestingly, the current setup shows that DXY has returned to a similar structural zone seen before past rollovers. As shown in the chart below, the DXY is now trending downwards.
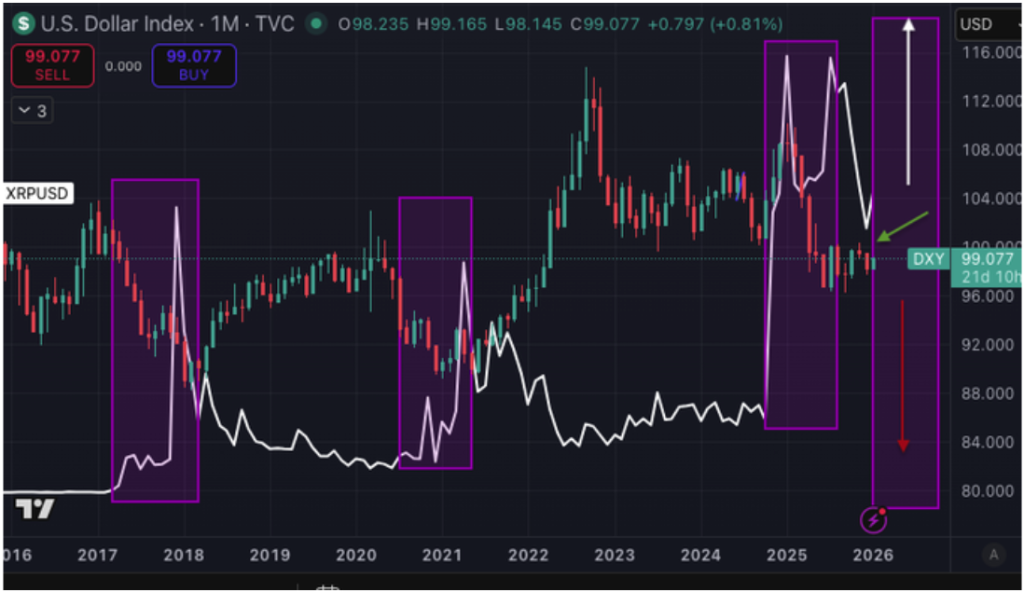
US Dollar Index, XRPUSD. Source: @Bird_XRPL On X
XRP To New All-Time Highs?
The first highlighted phase captures the late-2017 to early-2018 cycle, when a weakening dollar backdrop lined up with XRP’s rally run into the cycle peak in the mid-$3 range.
A similar relationship appeared around the 2020-2021 window, where dollar softness was followed by XRP surging to $1.90 at its cycle top. The latest was in H1 2025, which culminated in XRP reaching its current all-time high of $3.65 in July.
The important context is why the current moment is a decision point. At the time of writing, the DXY is sitting around 99, and from here it can either turn lower and start printing red candles again or catch a bid and print green.
If DXY starts printing red candles again and rolls over, the pattern Bird is pointing to suggests the macro backdrop becomes supportive for another strong XRP leg higher, which is why a new all-time high above $3.65 could come into view within the next few months.
If DXY prints green and strengthens, that would be the opposite signal: it can tighten liquidity conditions and keep XRP’s price action capped in consolidation around $2 before any breakout attempt. Either way, the dollar’s next move will signal what comes next.
Featured image from Unsplash, chart from TradingView
Related Articles
National Debt Bomb Ignited? Musk Warns U.S. Will Be 1000% Bankrupt Without AI
TradingKey - Tesla (TSLA) CEO Elon Musk recently issued another warning regarding the rapidly ballooning U.S. national debt. He stated clearly that without artificial intelligence and robotics, the United States will inevitably head toward fiscal bankruptcy.
Tesla Stock Outlook: Competing With Rivian, Robotaxi Potential, and 2026 Prospects
There is much conversation about the prospect of investing in Tesla (TSLA) as we move closer to 2026. The volatility of its share price in 2025 is leading many investors to consider if they should purchase shares of Tesla given the alternatives available in terms of electric vehicles (Rivian, etc.).
A Crash After a Surge: Why Silver Lost 40% in a Week?
TradingKey - Spot silver (XAGUSD) prices continue to decline. Silver plunged 20% on Thursday, breaking below $71 per ounce, with the sell-off intensifying on Friday as prices fell further below $64. Compared to the all-time high set on January 29, silver prices have retraced more than 40%, wiping out nearly all gains accumulated over the previous month.
Is Bitcoin’s Four-Year Cycle Dead in 2026?
Is the Bitcoin 4-year cycle dead? After 2025 broke historical records with a red post-halving year, institutional analysts explore if the Bitcoin price has decoupled from the halving countdown. Analyze the impact of spot ETFs, global liquidity, and the roadmap to the 2028 halving in this 2026 market

