

Gold stalls Wednesday’s recovery from 100-day SMA support amid a firmer USD

- Gold drifts lower on Thursday as hawkish FOMC Minutes underpin the US Dollar.
- Hopes for a Russia-Ukraine peace deal also exerted pressure on the XAU/USD pair.
- The global PMIs could influence the commodity ahead of Fed Chair Powell’s speech on Friday.
Gold (XAU/USD) meets with some supply during the Asian session on Thursday and stalls the previous day's goodish recovery from the $3,312-3,311 area, or a nearly three-week low. Minutes from the late July FOMC policy meeting released on Wednesday read on the hawkish side, with participants more worried about inflation than the labour market. This further tempers bets for a jumbo interest rate cut by the Federal Reserve (Fed) in September, which acts as a tailwind for the US Dollar (USD) and drives some flows away from the non-yielding yellow metal.
Adding to this, the optimism over a possible agreement to end the protracted Russia-Ukraine conflict turns out to be another factor that undermines demand for the safe-haven Gold. Meanwhile, US President Donald Trump's calls on Fed Governor Lisa Cook to resign after mortgage fraud allegations raised concerns about the central bank's independence. This might hold back the USD bulls from placing aggressive bets and support the bullion. Traders now look to the flash global PMIs for some impetus ahead of Fed Chair Jerome Powell's speech at the Jackson Hole Symposium.
Daily Digest Market Movers: Gold struggles to build on Wednesday’s recovery amid reduced Fed rate cut bets
- Minutes of the July 30-31 FOMC policy meeting released on Wednesday showed that almost all officials supported keeping rates unchanged, and a majority of participants judged the upside risk to inflation. Furthermore, policymakers noted rising threats to the economy that would warrant monitoring, though they largely agreed that their current stance was the appropriate way to go.
- This comes amid signs of a gain of momentum in price pressures and continues to force investors to price out the possibility of a more aggressive policy easing by the Federal Reserve. This, in turn, assists the US Dollar to stand firm near its highest level in more than a week and fails to assist the non-yielding Gold to capitalize on the previous day's recovery from a three-week low.
- Investors fretted about the central bank's independence after US President Trump demanded the resignation of Fed Governor Lisa Cook over unproven mortgage fraud allegations. Moreover, Trump has repeatedly attacked Fed Chair Jerome Powell for not cutting interest rates and even threatened to fire him. This caps the USD gains and acts as a tailwind for the precious metal.
- Russian Foreign Minister Sergey Lavrov warned on Wednesday that attempting to resolve security issues relating to Ukraine without the participation of Moscow is a road to nowhere. Lavrov also accused European leaders of making clumsy attempts to change Trump's position on Ukraine. This keeps geopolitical risks in play and should contribute to limiting losses for the XAU/USD pair.
- Traders now look forward to the release of flash PMIs for a fresh insight into the global economic health, which, in turn, will drive the broader risk sentiment and provide some impetus to the commodity. Apart from this, the US Weekly Initial Jobless Claims and the Philly Fed Manufacturing Index might influence the USD and produce short-term opportunities around the commodity.
- The focus, however, will remain glued to Fed Chair Jerome Powell's speech at the Jackson Hole Symposium. Investors will look for cues about the Fed's policy stance and rate-cut path, which will play a key role in determining the next leg of a directional move for the Greenback and the yellow metal.
Gold needs to surpass the weekly top to back the case for a further recovery towards $3,400
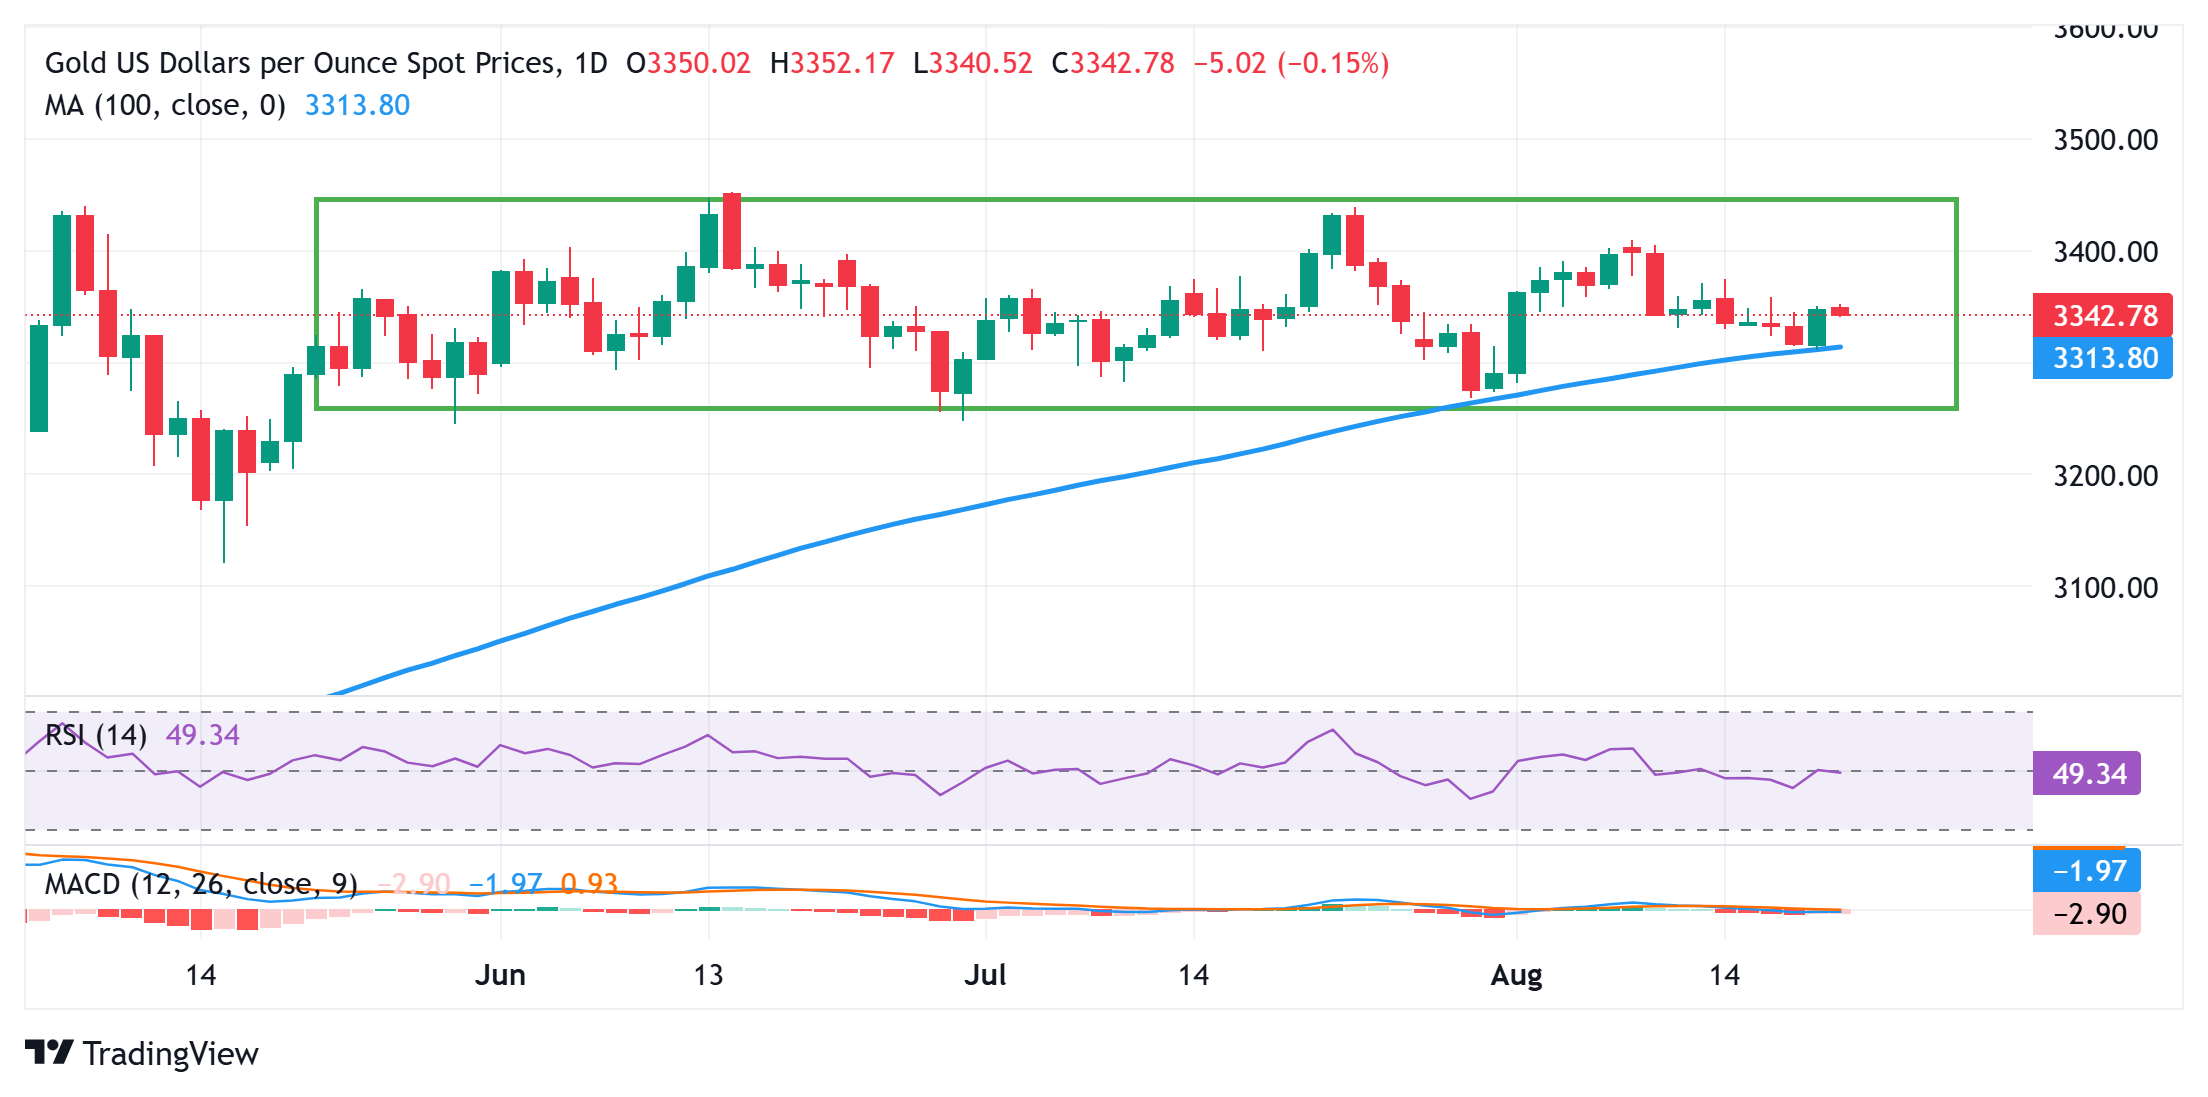
The overnight recovery move reaffirmed the 100-day Simple Moving Average (SMA) pivotal support near the $3,312-3,311 area, which should continue to protect the immediate downside. A convincing break below, however, might prompt some technical selling and drag the Gold price below the $3,300 mark, towards the $3,270-3,265 strong horizontal support. The latter represents the lower boundary of a three-month-old trading range, which, if broken, will suggest that the commodity has topped out and pave the way for a further near-term depreciating move.
On the flip side, sustained strength beyond the Asian session peak, around the $3,352 region, might trigger a short-covering rally and lift the Gold price to the $3,375 intermediate hurdle en route to the $3,400 mark. Some follow-through buying would set the stage for an extension of the momentum towards challenging the $3,434-3,435 heavy supply zone, also marking the top boundary of a multi-month-old trading range.
US Dollar PRICE This week
The table below shows the percentage change of US Dollar (USD) against listed major currencies this week. US Dollar was the strongest against the New Zealand Dollar.
| USD | EUR | GBP | JPY | CAD | AUD | NZD | CHF | |
|---|---|---|---|---|---|---|---|---|
| USD | 0.60% | 0.78% | 0.18% | 0.48% | 1.39% | 1.86% | -0.05% | |
| EUR | -0.60% | 0.17% | -0.45% | -0.13% | 0.80% | 1.22% | -0.64% | |
| GBP | -0.78% | -0.17% | -0.71% | -0.28% | 0.63% | 1.05% | -0.85% | |
| JPY | -0.18% | 0.45% | 0.71% | 0.33% | 1.25% | 1.72% | -0.21% | |
| CAD | -0.48% | 0.13% | 0.28% | -0.33% | 0.90% | 1.38% | -0.56% | |
| AUD | -1.39% | -0.80% | -0.63% | -1.25% | -0.90% | 0.42% | -1.47% | |
| NZD | -1.86% | -1.22% | -1.05% | -1.72% | -1.38% | -0.42% | -1.91% | |
| CHF | 0.05% | 0.64% | 0.85% | 0.21% | 0.56% | 1.47% | 1.91% |
The heat map shows percentage changes of major currencies against each other. The base currency is picked from the left column, while the quote currency is picked from the top row. For example, if you pick the US Dollar from the left column and move along the horizontal line to the Japanese Yen, the percentage change displayed in the box will represent USD (base)/JPY (quote).
Recommended Articles


Comments (0)
Click the $ button, enter the symbol, and select to link a stock, ETF, or other ticker.