tradingkey.logo
tradingkey.logo
Search

Collective Investments

LIST1077
1356.256USD
+81.926+6.43%
Close 11-04 16:00(ET)
42.17BMarket Cap
7.70MVolume

Key Figures

1302.298Open
1358.935High
7.70MVolume
23Up
4Down
0Unchanged
42.17BMarket Cap
1274.330Prev. Close
1300.762Low
412.12MTurnover

Collective Investments

1356.256
+81.926+6.43%

Related Stocks

No.
Name
Price
Change
Chg %
Total Score
Time
Volume
Turnover
Market Cap
Shares
Amplitude
Volume Ratio
52wk High
52wk Low
Dividends
Div Yield
5D
10D
20D
60D
120D
250D
Year to Date
Watchlist
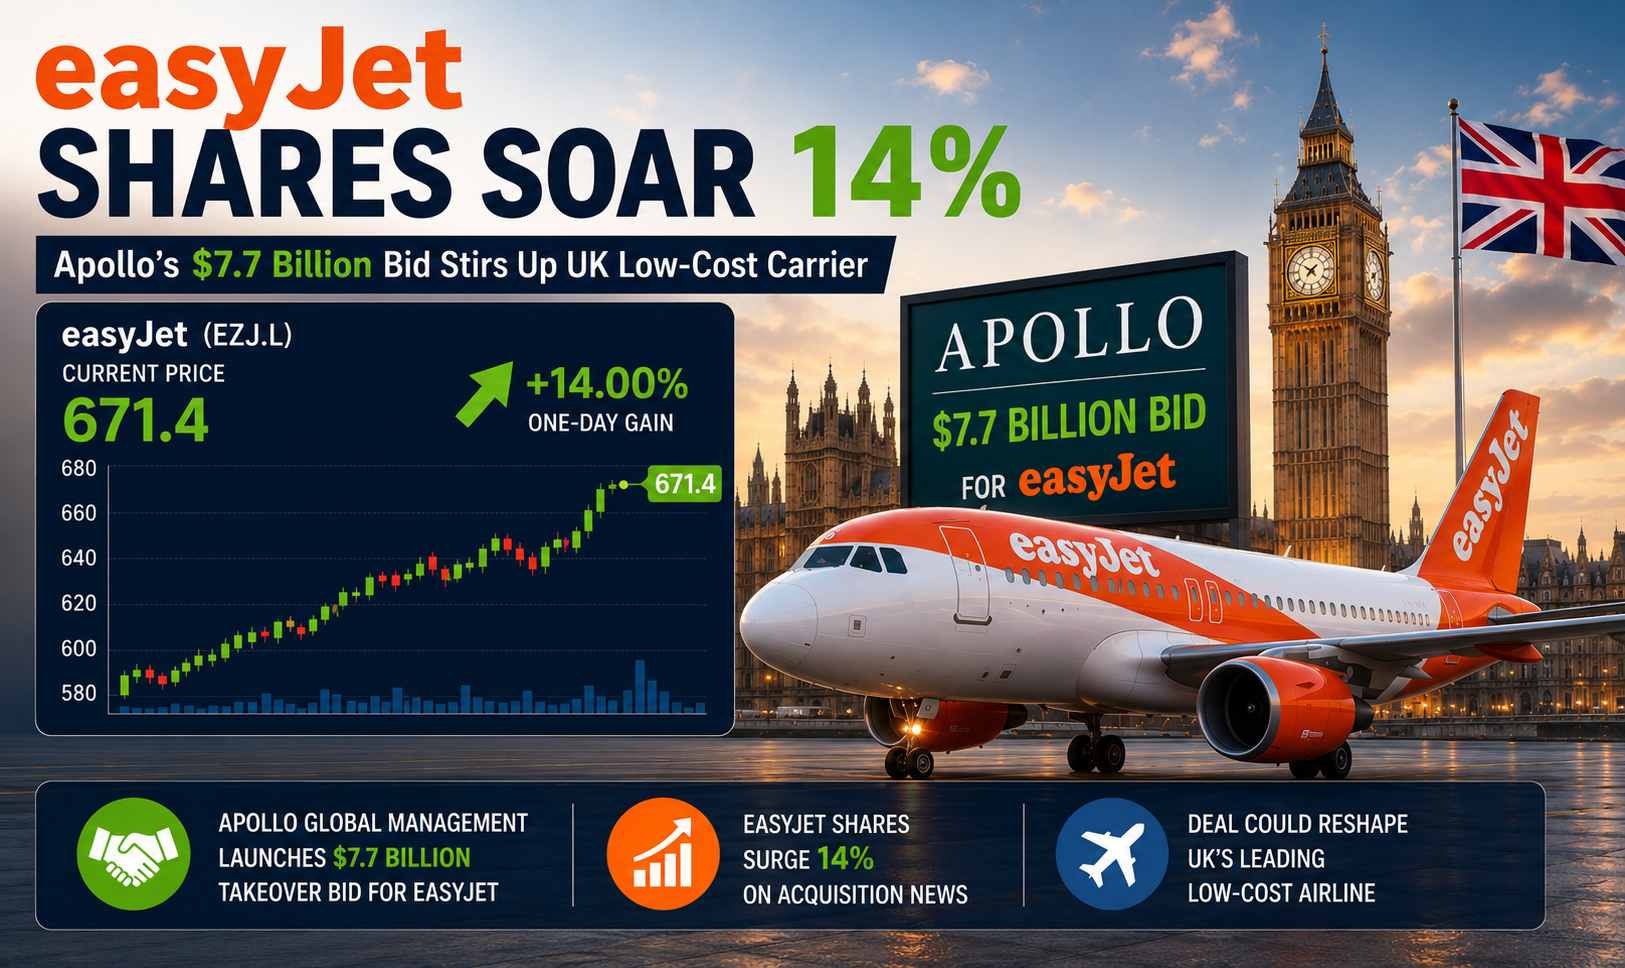
Apollo Global Management Inc
APO
122.760
+9.210
+8.11%
6.67
3.18M
383.60M
72.49B
590.54M
9.74
259.98
151.387
98.726
2.04
1.66
+8.21%
+9.91%
+6.24%
-12.12%
-8.65%
-6.70%
-14.13%
Pennantpark Investment Corp
PNNT
3.230
+0.140
+4.53%
6.00
655.40K
2.06M
210.92M
65.30M
7.60
1.26
5.728
2.780
0.96
29.63
+10.24%
+14.54%
+2.88%
-10.61%
-18.40%
-42.83%
-39.36%
Horizon Technology Finance Corp
HRZN
4.030
+0.170
+4.40%
5.41
42.99K
174.67K
270.13M
67.03M
6.86
0.10
5.576
3.401
1.17
28.88
+0.25%
-0.25%
-8.45%
-12.73%
+3.81%
-25.33%
-25.80%
4
Oaktree Specialty Lending Corp
OCSL
12.610
+0.410
+3.36%
6.40
69.54K
879.83K
1.11B
88.09M
5.24
0.15
12.316
10.064
1.62
12.83
+6.86%
+12.09%
+8.24%
+1.06%
+10.17%
+3.39%
+8.46%
5
SLR Investment Corp
SLR Investment Corp
SLRC
12.190
+0.390
+3.31%
5.80
58.09K
711.54K
664.96M
54.55M
6.94
0.16
15.566
10.960
1.64
13.43
+5.45%
+10.82%
+6.70%
-3.36%
-0.91%
-12.76%
-14.67%
6
Crescent Capital BDC Inc
CCAP
9.640
+0.290
+3.10%
6.42
18.14K
174.79K
355.23M
36.85M
5.02
0.11
13.242
8.395
1.68
17.40
+6.99%
+13.41%
+6.99%
-12.37%
-13.55%
-21.93%
-23.64%
7
FS KKR Capital Corp
FS KKR Capital Corp
FSK
11.460
+0.330
+2.96%
6.13
943.75K
10.82M
3.17B
276.34M
4.40
157.59
13.757
8.999
2.58
22.55
+7.00%
+13.69%
+6.61%
-2.89%
+14.62%
-8.13%
-12.32%
8
OFS Capital Corp
OFS Capital Corp
OFS
3.840
+0.110
+2.95%
5.92
1.21K
4.60K
51.46M
13.40M
7.64
0.02
4.662
2.487
1.02
26.84
-4.00%
-3.52%
-7.25%
+10.53%
+16.49%
-14.56%
-6.84%
9
PennantPark Floating Rate Capital Ltd
PFLT
6.980
+0.190
+2.80%
6.61
224.98K
1.58M
692.56M
99.22M
4.63
0.28
8.675
6.152
1.23
17.60
+3.71%
+12.76%
+6.15%
-3.43%
-13.69%
-12.43%
-15.37%
10
Gladstone Capital Corp
GLAD
19.680
+0.530
+2.77%
5.95
15.69K
309.60K
444.57M
22.59M
4.85
0.11
19.737
15.498
1.49
7.59
+4.90%
+8.30%
+5.98%
+3.07%
+7.66%
+14.03%
+4.11%
tradingkey.logo
Risk Warning: Our Website and Mobile App provides only general information on certain investment products. Finsights does not provide, and the provision of such information must not be construed as Finsights providing, financial advice or recommendation for any investment product.
Investment products are subject to significant investment risks, including the possible loss of the principal amount invested and may not be suitable for everyone. Past performance of investment products is not indicative of their future performance.
Finsights may allow third party advertisers or affiliates to place or deliver advertisements on our Website or Mobile App or any part thereof and may be compensated by them based on your interaction with the advertisements.
© Copyright: FINSIGHTS MEDIA PTE. LTD. All Rights Reserved.