


AMD Stock Price Forecast: Bernstein Sees Server Revenue Doubling by 2027, Shares May Recover to $560



AI Podcast


Anthropic’s rapid three-day prompt-processing adaptation on AMD’s MI355X GPU helps lower software migration barriers, challenging Nvidia’s dominance. Meanwhile, Bernstein projects AMD’s server CPU revenue to double by 2027, driven by rising market share and average selling prices, offsetting PC business weakness. Technically, AMD is in a rebound phase near the $500.05 Fibonacci support. The primary overhead resistance spans $530.31 to $533.90. Investors must monitor key moving averages; a decisive breach below $500 risks a deeper retracement toward $462.62, while sustained buying could target $560.
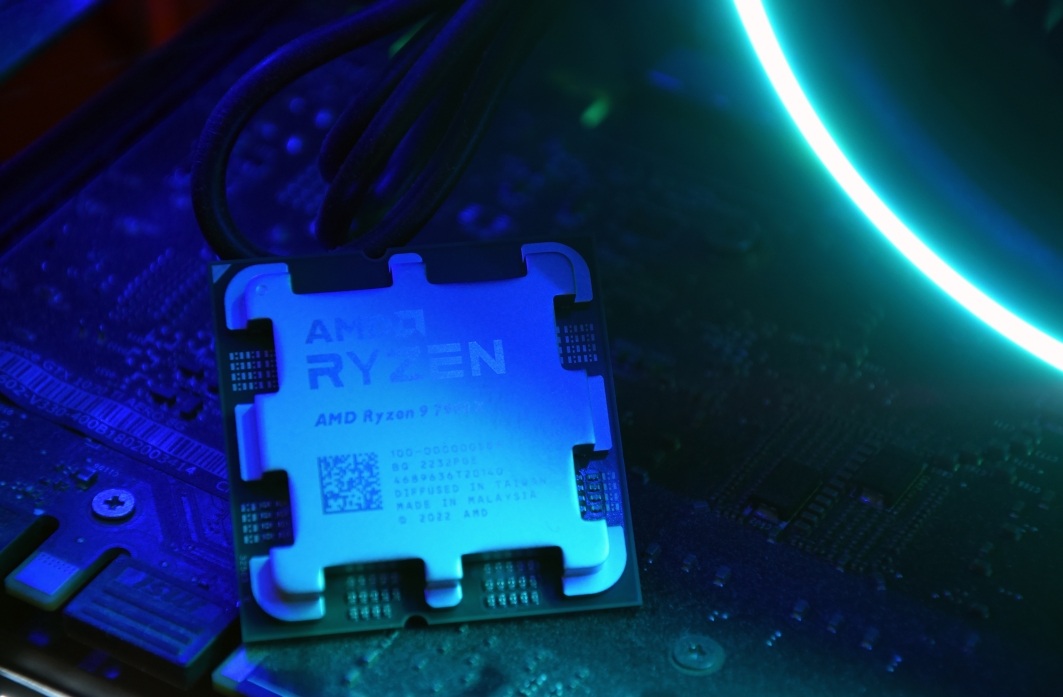
TradingKey - Advanced Micro Devices (AMD) has seen a new competitive signal in its AI business. Anthropic stated during its IPO roadshow that Claude Mythos Preview took about three days to bring the prompt-processing stage of one of its models to a usable performance level on the AMD MI355X GPU, with nearly all relevant underlying compute code ported or written by Claude.
This means AI tools could help lower software adaptation costs for adopting AMD chips, supporting the company in securing more computing workloads. Meanwhile, Bernstein expects its server business revenue to potentially double year over year by 2027. Falling software migration barriers and growing server demand together support AMD in weathering weakness in its PC business.
The "three-day adaptation" disclosed by Anthropic has a clear scope: it targets prompt processing for a single model—specifically, the stage of reading and processing inputs before generating responses—and does not mean the entire training and inference system was migrated within three days.
This is expected to weaken customers' incentive to stay reliant on Nvidia (NVDA) due to migration costs, allowing AMD to compete for orders more on performance, supply capability, and cost of use.
On the other hand, compared with software progress in GPUs, the server CPU business has already demonstrated improvements in pricing and market share. According to Bernstein, AMD's revenue share in the x86 server CPU market rose by about 1 percentage point quarter over quarter to 45.6% in the third quarter, while the average selling price of server CPUs rose by about 12% quarter over quarter and about 34% year over year. This indicates that AMD is capitalizing on growing server demand through higher product value and revenue share.
Bernstein believes AMD's supply chain management capabilities will help it seize this round of expansion opportunities and expects the company's server business revenue to very likely double year over year by 2027.
From a technical perspective, AMD is currently in a rebound phase following a lower open after breaking below moving average support, with the current support pivot at the 0.382 Fibonacci retracement level ($500.05). Since the price has not yet broken below this level, it should still initially be treated as a deepening pullback within a rebound; whether the current recovery structure can be preserved will depend on buying support below.
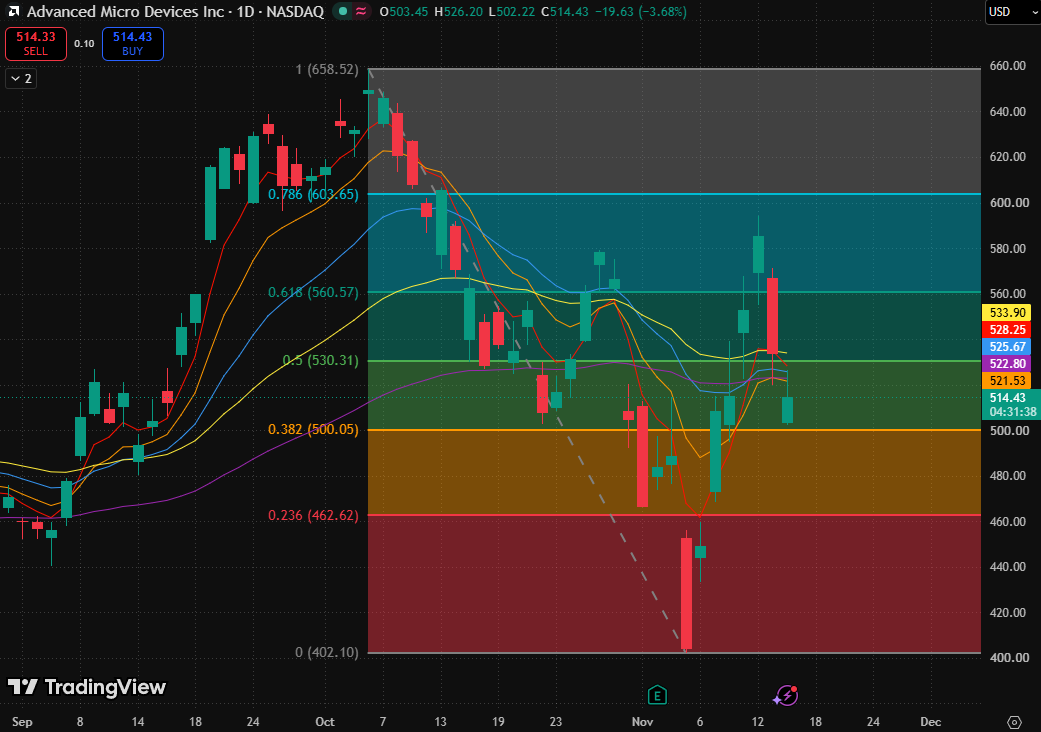
AMD stock chart, Source: TradingView
In terms of moving averages, the 5-day exponential moving average ($528.25) continues to fall, and the upward recovery of the 10-day exponential moving average ($521.53) and 20-day exponential moving average ($525.67) has also been interrupted. The 80-day exponential moving average ($533.90) and 160-day exponential moving average ($522.80) are likewise above the current price. The five moving averages are clustered between $521.53 and $533.90, with their cyclical order still intertwined; the price trading below all five moving averages indicates weakening buying support, though it cannot yet be characterized as a complete bearish alignment.
On the upside, focus closely on the moving average zone between $521.53 and $528.25; only if the stock finds buying support on a retest can the rebound turn into a sustained recovery. The primary overhead resistance zone is the $530.31–$533.90 range formed by the 0.5 Fibonacci retracement level and the 80-day exponential moving average; if the stock successfully breaks above this level, it could climb to $560.
The biggest risk is that buying support near $500 is decisively breached and turns into resistance during a rebound. In that scenario, the pullback would enter a lower retracement range, with downside price action first to be observed around $462.62, while the gains from this round of recovery would be further surrendered.
This content was translated using AI and reviewed for clarity. It is for informational purposes only.
Recommended Articles







Comments (0)
Click the $ button, enter the symbol, and select to link a stock, ETF, or other ticker.