


MSTR Officially Dropped From MSCI, Shares Fall Below $120 Post-Market and Risk Sliding Toward $105



AI Podcast


On November 11, Eastern Time, Strategy shares fell over 2% in after-hours trading after MSCI announced the company's removal from key equity indices, effective after the close on November 30, due to its resemblance to an investment fund. This exclusion threatens passive fund outflows, potentially impairing the company's equity-backed Bitcoin financing model. Technically, the stock has breached major moving averages and its prior low, signaling intensified bearish momentum. Short-term downside risks target key support levels at $105 and $100, while overhead resistance remains near $125.

TradingKey - On November 11, Eastern Time, Strategy (MSTR) shares rose 1.06% during regular trading hours to close at $122.35, but fell below $120 in after-hours trading, down about 2.3%, after MSCI officially announced its removal from relevant equity indices. This index adjustment could affect passive funds' holdings of MSTR while heightening market concerns over the company's future financing capacity and its Bitcoin reserve model.
MSCI Officially Drops MSTR as Passive Outflow Risks Rise
On November 11, global index provider MSCI announced the results of its November 2026 index review, deciding to remove MSTR from relevant indexes such as MSCI USA and MSCI World, with the adjustment taking effect after the close on November 30. MSCI stated that MSTR's business and asset structure more closely resemble an investment fund or a non-operating company rather than a traditional operating enterprise, and it therefore no longer meets the inclusion criteria for the relevant indexes.
For MSTR, the most direct impact of this adjustment is a potential reduction in passive investment capital. ETFs and index funds tracking MSCI indexes typically allocate assets according to index constituents; following MSTR's removal, relevant funds will need to sell their holdings around the effective date. MSTR previously warned that an exclusion by MSCI could trigger approximately $2.8 billion in stock sell-offs. JPMorgan also previously estimated that if other major index providers take similar measures, MSTR's potential capital outflows could reach $8.8 billion. However, this figure is a conditional estimate rather than a confirmed actual outflow.
Notably, being removed from MSCI indexes could impact Strategy's long-standing financing model. The company has consistently purchased Bitcoin through the issuance of common shares, preferred shares, and debt financing, with its stock valuation and market financing capabilities serving as an essential foundation for expanding its Bitcoin reserves. If the index exclusion leads to reduced institutional holdings and lower stock liquidity, the cost of raising capital through future share issuances could rise, thereby affecting the company's ability to continue increasing its Bitcoin holdings and potentially putting further downward pressure on its stock price.
MSTR Stock Price Technical Analysis
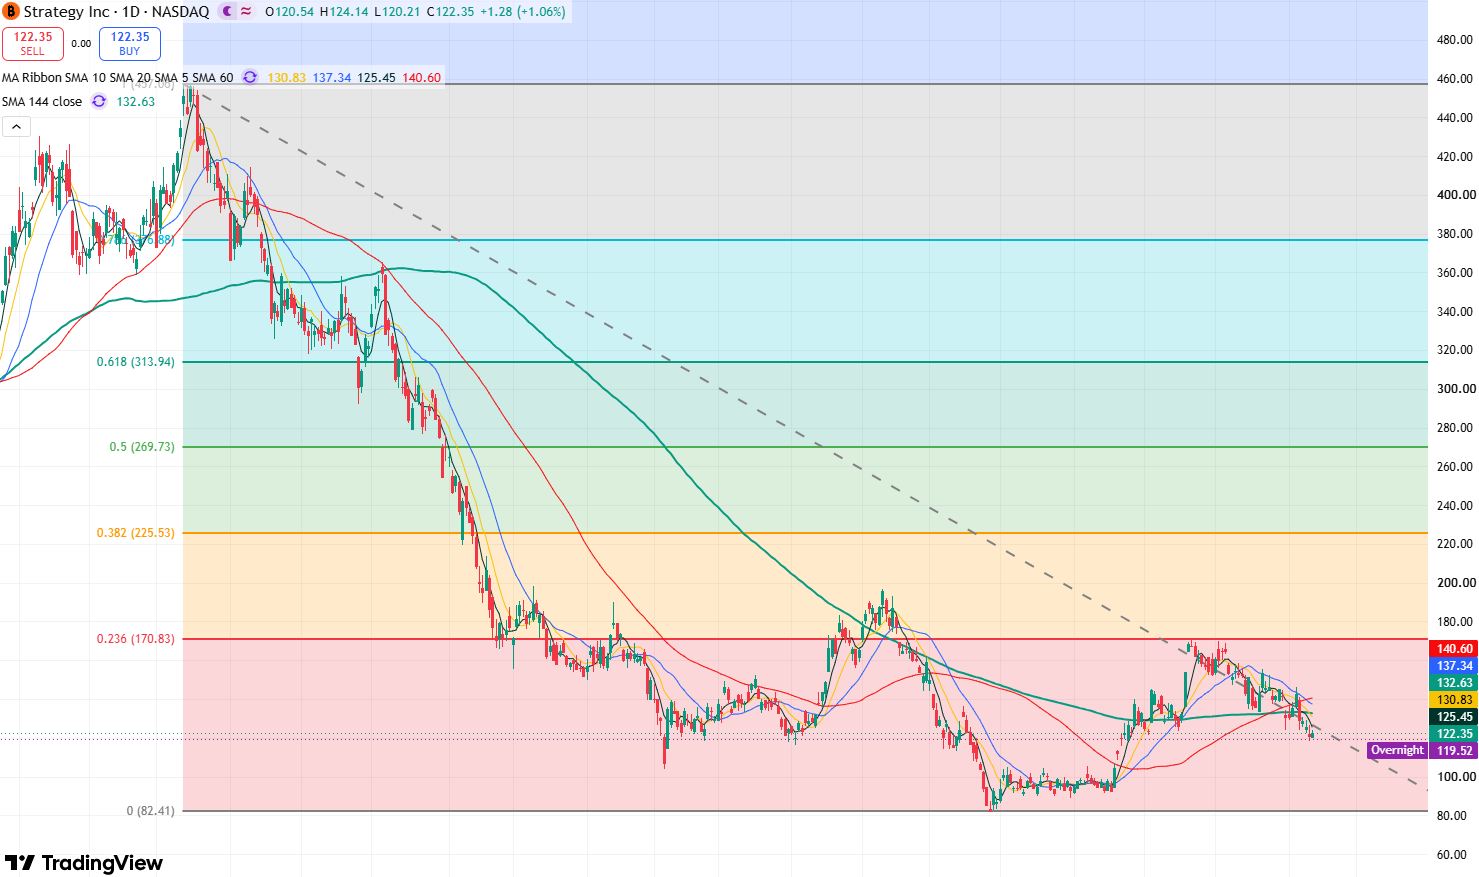
MSTR daily stock price chart, Source: TradingView
Judging from MSTR's daily chart, the stock has continued to weaken recently and broke below its Sept. 2 low of $121.38 to hit a near-three-month low. In Wednesday's after-hours trading, the stock dropped further below $120, further reinforcing market bearish momentum and suggesting that the downward trend may continue in the short term.
Meanwhile, the stock has broken below key moving averages, including the 5-day, 10-day, 20-day, 60-day, and 144-day lines. Furthermore, the 5-day, 10-day, and 20-day moving averages have consecutively crossed below both the 60-day and 144-day medium-to-long-term moving averages, significantly strengthening bearish momentum in the market.
Currently, if MSTR carries over its after-hours trend at today's open and falls below the $120 threshold, it will open up room for a deeper decline. The primary downside target will be to test the $105 support level. If this level fails to hold, the stock could drop further below $100 or even test the key support level at $80.
On the upside, the primary overhead resistance to watch is $125. A breakout above this level would allow the stock to stage a further rebound to test resistance near $134, with the next target higher near $146.
This content was translated using AI and reviewed for clarity. It is for informational purposes only.
Recommended Articles











Comments (0)
Click the $ button, enter the symbol, and select to link a stock, ETF, or other ticker.