


Applied Materials Stock Forecast: Besi Expansion Meets $350 Recovery Test



AI Podcast


Applied Materials faces a critical test ahead of its November 12 earnings, balancing robust AI-driven advanced packaging demand and strategic partnerships like Besi with technical weakness and regulatory risks in China. Recent fiscal results showed strong revenue and margin expansion, supported by initiatives such as the $5 billion EPIC Center. However, the daily chart remains bearish while trading below the $350 resistance level, with immediate support at $295.55. While long-term fundamentals are bolstered by packaging growth and cash-return targets, investors must navigate export-licensing uncertainties, fluctuating cash flows, and near-term downside technical risks.
TradingKey - Applied Materials’ (NASDAQ: AMAT) Sunday outlook combines a stronger commitment to advanced packaging with a damaged daily chart. When markets reopen Monday, investors will be looking towards November 12 earnings for evidence that AI-related equipment demand can sustain profitable growth.
The latest verified completed close at the research cutoff was $319.25, according to historical market data. Friday’s session had not finished, so this is the preview’s reference price rather than a confirmed weekly close. The immediate recovery test is $350, with $295.55 support below.
Besi Strengthens the Packaging Strategy
Applied’s October 26 filing confirmed an agreement that would increase its Besi ownership to approximately 20%. Delivery of the additional shares remains subject to the applicable US antitrust waiting period.
The strategic announcement connects the investment with hybrid bonding, which joins chips through closely spaced connections, and other advanced-packaging technologies. Applied said it does not intend to seek Besi board representation.
The opportunity is to capture more equipment spending as processors and memory become harder to integrate. A larger equity stake supports the partnership, but does not guarantee customer orders or give Applied control of Besi.
Profitable Growth Sets a High Earnings Bar
Fiscal third-quarter results showed revenue of $9.12 billion, up 25%, and adjusted EPS of $3.50, up 41%. GAAP EPS was $3.17. Adjusted gross margin reached 50.4%, compared with 48.9% a year earlier.
Profit growth outpacing sales suggests better operating leverage, meaning expenses absorbed a smaller share of revenue. The distinction between GAAP and adjusted earnings still matters: the reconciliation excludes items including unrealised losses on strategic investments. I would focus on whether equipment profitability remains strong as investment spending increases.
AI Demand Reaches Beyond One Manufacturing Step
Management’s August commentary projected more than 70% packaging-revenue growth in calendar 2026. DRAM-related revenue, including high-bandwidth-memory packaging, increased 52% year over year. These describe Applied’s equipment business, not sales of memory chips or a separately disclosed total for AI revenue.
However, equipment deliveries depend on factory readiness and installation schedules. Strong demand for AI systems does not ensure that every planned chip-factory purchase arrives in the same quarter.
EPIC Must Turn Collaboration Into Sales
Applied unveiled its $5 billion EPIC Center on October 12. Its founding partners include TSMC, Intel, Samsung, SK hynix and Micron, according to the opening announcement. The centre brings customer engineers and equipment developers together to accelerate commercialisation.
Working earlier on manufacturing problems could improve Applied’s chances of having its equipment selected for future production. Partnerships are not purchase commitments, though.
China Growth Still Carries Licensing Risk
The published earnings remarks put China at 26% of combined Semiconductor Systems and Applied Global Services revenue. Management expected China revenue to grow during calendar 2026, led by 28-nanometre foundry-logic investment.
A February settlement required Applied to pay $252.5 million to resolve Commerce Department allegations concerning historical China shipments. The company said related Justice Department and SEC investigations closed without action. Resolving the historical case does not remove future export-licensing risk.
Cash Returns Need a Longer-Term Comparison
The cash-flow tables showed $3.04 billion of quarterly operating cash flow and $2.33 billion of free cash flow. However, nine-month free cash flow was $3.58 billion versus $3.66 billion a year earlier. The strong quarter does not establish uninterrupted cash-growth momentum.
Applied’s October investor update reiterated a goal of distributing 80% to 100% of free cash flow over time. Its approximately 54% adjusted gross-margin and 40% adjusted operating-margin targets are ambitions for 2030, not current results.
November 12 Tests the Next Growth Phase
Applied’s earnings notice confirms the call for November 12 at 4:30 p.m. Eastern. Fourth-quarter guidance calls for $10.25 billion in revenue, plus or minus $500 million, and adjusted EPS of $4.02, plus or minus $0.20.
The revenue outlook and packaging demand will matter beyond the reported quarter. Management also flagged a 14-week first quarter of fiscal 2027, so the extra week needs consideration when judging the next sequential forecast. Neither the guidance nor the long-term targets are achieved results.
Applied Materials Technical Analysis: $350 Caps the Immediate Recovery
The supplied daily chart shows lower highs and lower lows beneath a descending trendline. The $319.25 reference close sits near the selloff candle’s $316.95 low, indicating that buyers recovered little ground before that session ended. The candle’s $350 high is the immediate recovery hurdle.
I remain bearish while rebounds fail near $350. Rejection there would favour a move towards $295.55 support. A daily close below $295.55 would strengthen the downside case and expose $245.86, rather than assuming that a brief intraday breach confirms another decline.
RSI, a momentum gauge, stands at 25.87 and is oversold. That makes a rebound plausible, but MACD remains below zero and its signal line, consistent with weak momentum.
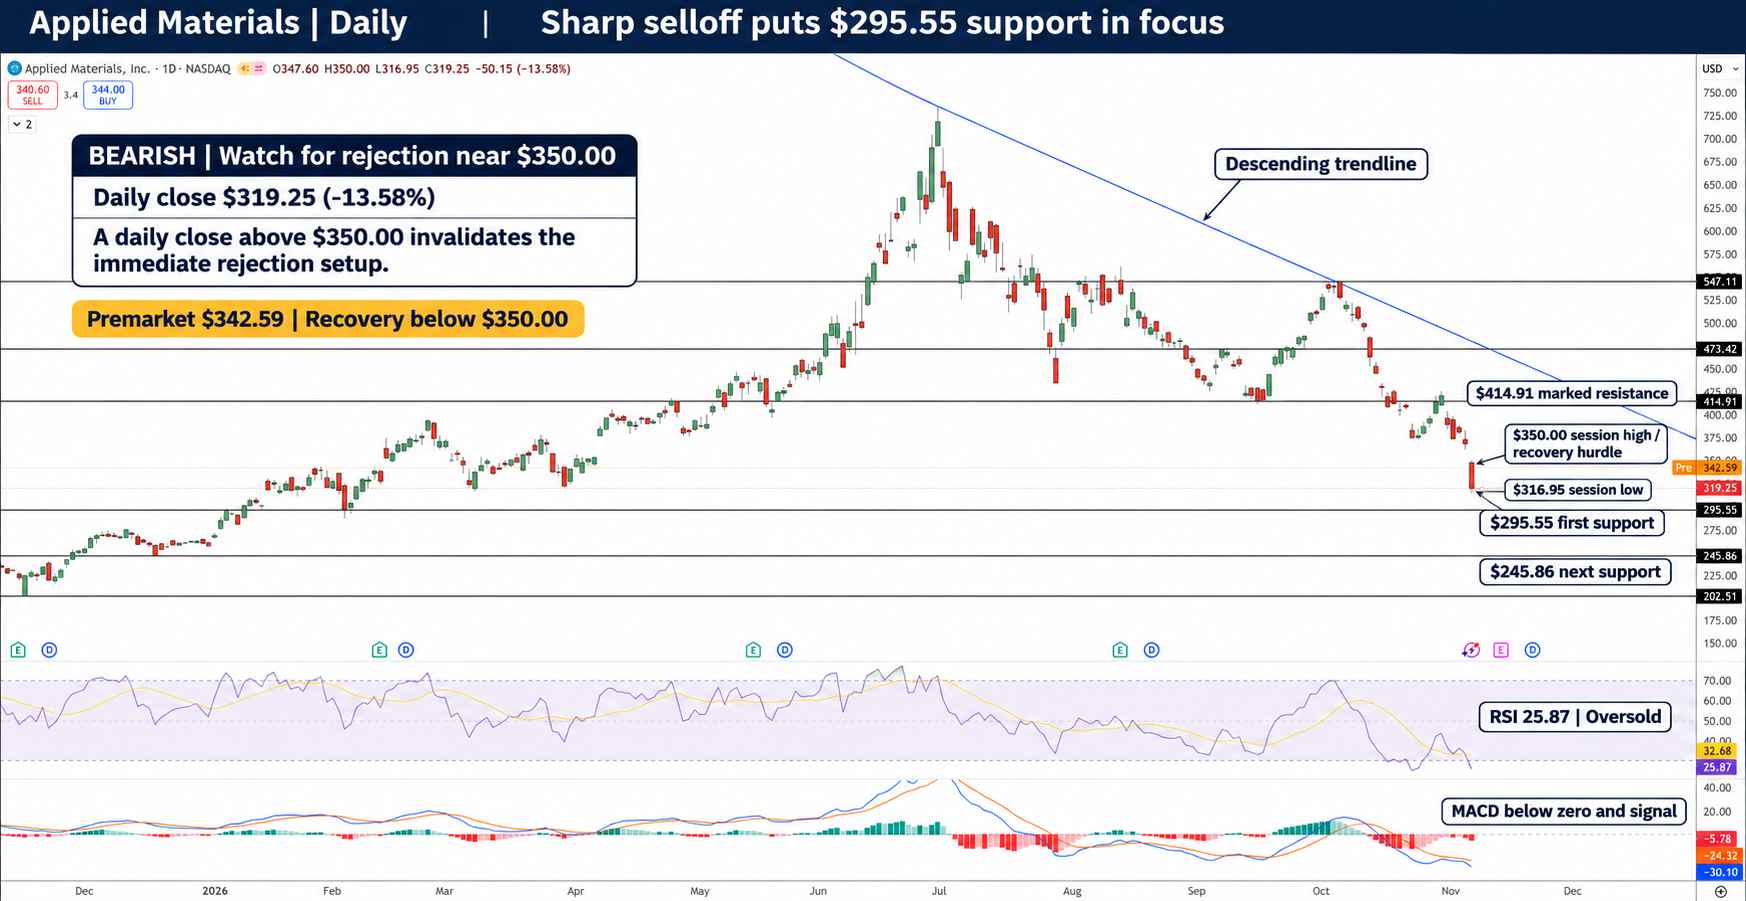
AMAT Price Chart - Source: Tradingview
A daily close above $350 would invalidate the immediate rejection setup. It would not alone reverse the broader downtrend: the descending trendline would still need reassessment, and $414.91 remains the higher marked resistance. Next week’s earnings could change the structure, making the subsequent close and retest more useful than the initial price jump.
Key Levels
- Latest verified completed close: $319.25 at the pre-weekend research cutoff
- Immediate resistance: $350.00
- Higher resistance: $414.91
- Immediate support: $295.55
- Downside target: $245.86
- RSI: 25.87, oversold
FAQ
Has Applied Materials completed its larger Besi investment?
The disclosed agreement would lift ownership to approximately 20%, subject to the antitrust waiting period for share delivery.
What would improve AMAT’s immediate technical outlook?
A daily close above $350 would invalidate the rejection setup, although the broader downtrend needs further confirmation.
Bottom Line
Packaging demand supports the fundamental case, but cash returns and China access remain key risks. The chart stays bearish below $350, with $295.55 the next support test.
Recommended Articles








Comments (0)
Click the $ button, enter the symbol, and select to link a stock, ETF, or other ticker.