


Airbnb Stock Forecast: $12 Billion Buyback Puts $192.90 in Focus



AI Podcast


Airbnb shares surged 11% in extended trading following strong third-quarter results, driven by 19% revenue growth to $4.87 billion, accelerated bookings, and a new $12 billion share repurchase authorization. Management raised full-year guidance, supported by AI-driven customer service cost reductions. However, risks remain regarding higher cancellation rates from flexible payment options and deferred marketing expenses affecting margins. Technically, the stock breached the $179.44 resistance in after-hours trading, but a regular-session close above this level is required to confirm further upside toward $192.90, while a drop below $164.44 invalidates the recovery thesis.
TradingKey - Airbnb (NASDAQ: ABNB) closed November 5 at $170.13, down 3.54%, before releasing earnings. At 7:59 p.m. Eastern, shares traded at $188.84, up 11.00% from that close. The earnings response lifted the stock above the chart’s $179.44 barrier in extended trading. Stock Analysis records both prices.
Faster bookings and a new $12 billion repurchase authorization strengthen the outlook. The next test is whether those reservations become completed stays and cash, particularly as flexible payments allow guests to book earlier.
Booking Growth Extends Beyond Higher Prices
Third-quarter revenue rose 19% to $4.87 billion, or 16% excluding currency effects. Gross booking value, the value of transactions across Airbnb’s platform, increased 21% to $27.7 billion. Nights and Seats Booked rose 16% to 155 million. Volume contributed substantially alongside higher accommodation prices.
The improvement also reached established markets. Every region delivered double-digit nights growth, North America had its fastest expansion in four years, and first-time booker growth reached 13%. Broader demand makes the recovery more persuasive, though repeat visits will determine whether spending to attract new guests produces lasting returns.
Flexible Payments Create a Cancellation Test
Management estimated that Reserve Now, Pay Later added roughly three percentage points to quarterly booking growth. Excluding that effect, growth was approximately 13%, still faster than the previous quarter. The option lets guests reserve accommodation before paying, reducing the immediate cost of committing to a trip.
The filing also says these reservations have experienced higher cancellation rates than bookings paid partly or fully upfront. That makes completed stays especially important. I would want booking growth to show up in revenue and collections before assuming every additional reservation has the same economic value as earlier bookings.
Summer Margins Benefited From Spending Timing
Adjusted EBITDA, an earnings measure excluding interest, taxes, depreciation, amortization and certain other costs, rose 22% to about $2.5 billion. Its margin reached 52%, versus 50% a year earlier. Some marketing expenditure moved into the fourth quarter, helping the summer comparison.
GAAP diluted EPS increased to $3.16 from $2.21. A $135 million reduction in the tax provision also helped net income. That tax comparison and the marketing shift both qualify the earnings acceleration. Continued operating improvement would be more convincing if margins hold up after the deferred marketing expense arrives.
Buyback Capacity Depends on Continued Cash Generation
Airbnb generated roughly $1.4 billion in quarterly free cash flow and $4.9 billion over the trailing year. Deferred guest payments held back working capital, while higher property purchases also affected quarterly cash generation. Collections deserve attention alongside growth.
The board approved an additional $12 billion repurchase authorization on November 3. Actual third-quarter repurchases totaled $712 million for 4.4 million shares, according to the filing. Future purchases could reduce the share count, but their pace depends on management’s decisions and available cash. The authorization provides no completion timetable.
AI Savings and Amex Broaden the Opportunity
Airbnb reported that approximately 40% of customer-support issues were resolved without a human agent, and support cost per booking fell more than 17%. Lower servicing costs could help offset spending to attract guests as volumes expand. A travel-planning and booking agent is planned for the first half of 2027, adding a prospective product catalyst.
The October 22 American Express partnership brings more than one million listings to Amex Travel for eligible US card members. Rewards could attract travelers who normally book elsewhere. The financial benefit depends on incremental reservations and repeat visits after accounting for the costs of reaching those customers.
Holiday Guidance Tests Growth After Marketing Catches Up
Airbnb forecasts fourth-quarter revenue of $3.22 billion to $3.28 billion, up 16% to 18%, including roughly two percentage points of currency benefit. Management raised full-year expectations to high-teens revenue growth and an adjusted EBITDA margin around 36%.
Fourth-quarter adjusted margin is expected to decline slightly year over year, partly because of marketing timing. Holiday execution is the next operating test. Strong completed-stay growth with improving collections would support the forecast, while rising cancellations or acquisition costs would weaken it.
Airbnb Technical Analysis: $179.44 Must Become Support
Airbnb’s latest completed close is $170.13, matching the supplied daily chart. On that daily setup, price remained above rising trendline support and the $164.44 floor, while $179.44 capped recovery. The verified $188.84 after-hours print moves the immediate focus to whether buyers can hold above that former barrier during regular trading.
I remain neutral pending confirmation from the regular session. A daily close above $179.44 would strengthen the recovery and favor $192.90, the next marked resistance. A close above $192.90 would confirm further upside, although the supplied chart provides no higher target.
The earlier RSI reading of 51.28 indicates balanced momentum, and MACD was marginally above its signal line. These readings describe the supplied chart before the full earnings reaction. If price falls back below $179.44, the breakout would lose credibility. A daily close below $164.44 would invalidate the broader recovery and expose $149.43. The gap still needs confirmation.
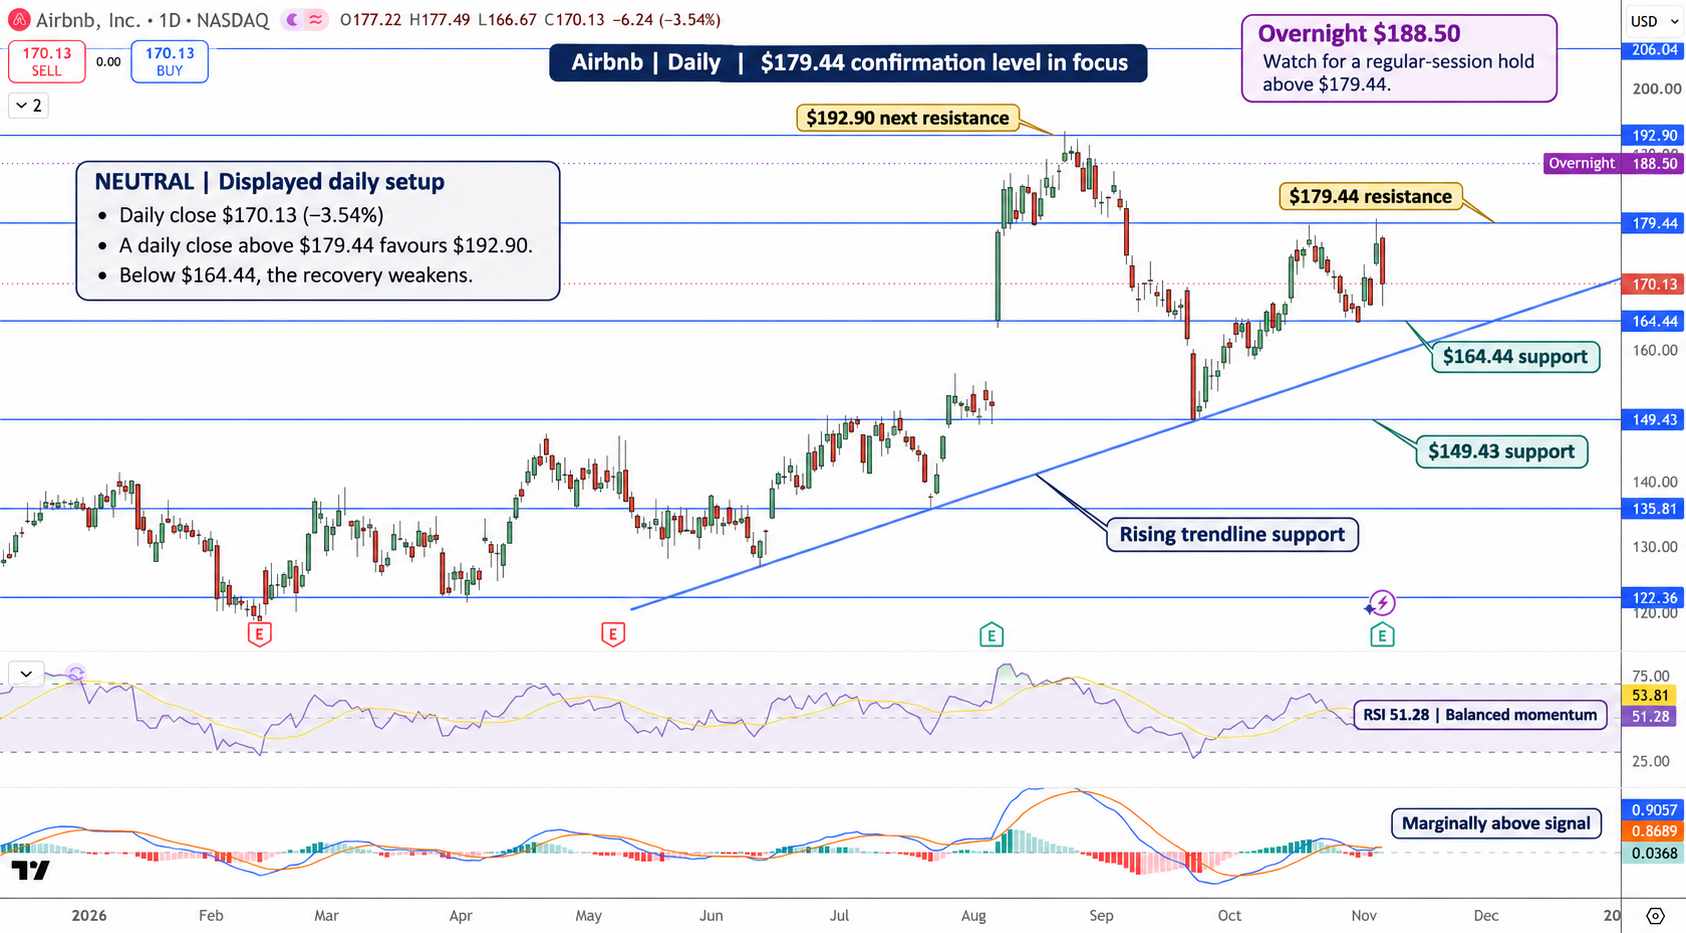
Airbnb Price Chart - Source: Tradingview
Key Levels
- Latest completed close: $170.13 on November 5
- After-hours reference: $188.84 at 7:59 p.m. Eastern on November 5
- Immediate resistance and upside target: $192.90
- Breakout support to confirm: $179.44
- Lower support and downside targets: $164.44, then $149.43
- Supplied chart RSI: 51.28, balanced before the earnings reaction
FAQ
Why did Airbnb rise after earnings?
Faster bookings, higher annual guidance and an additional $12 billion repurchase authorization supported the reaction.
What confirms Airbnb’s technical recovery?
A daily close above $179.44 would support a move toward $192.90. Losing $164.44 would invalidate the broader recovery.
Bottom Line
Airbnb’s demand recovery is constructive, provided deferred-payment bookings convert into stays and cash. The chart needs a regular-session close above $179.44 to support $192.90. Below $164.44, the recovery thesis fails.
Recommended Articles










Comments (0)
Click the $ button, enter the symbol, and select to link a stock, ETF, or other ticker.