


Tesla Stock Price Forecast: Shares Plunge Over 10% in Single Day to Near Three-Month Low, Risk Testing $300



AI Podcast


Tesla shares fell 10.77% on November 5, Eastern Time, closing at $343.69 amid a broader tech sector sell-off and U.S. midterm election policy shifts. Democratic victories in Texas sparked regulatory concerns over data center construction and Elon Musk's ventures, threatening Tesla's energy storage and chip projects. Goldman Sachs estimates potential moratoriums could impact 45% of planned U.S. capacity. Technically, breaching the $345 support and key moving averages weakens the short-term outlook, with downside targets at $330 and $300. Resistance stands between $350 and $355, as heightened volatility and diminishing AI investment risk appetite weigh on the high-valuation growth stock.

TradingKey - On November 5, Eastern Time, Tesla (TSLA) shares dropped sharply by 10.77% to close at $343.69, hitting an intraday low of $338.15, with trading volume rising to approximately 79.68 million shares. The stock had already fallen 3.34% on November 4, bringing the cumulative two-day decline to over 13%. Compared with its recent intraday peak of $414.23 on November 2, TSLA has pulled back by about 17%.
The recent drop in the stock price was primarily related to shifting policy expectations following the U.S. midterm elections. Reuters reported that after Democrats won several key races in Texas, the market began focusing on future approval processes for data center construction and the potential tightening of regulations on Elon Musk's companies. Goldman Sachs estimates that a potential moratorium on data centers could affect roughly 45% of planned new U.S. capacity. Because Tesla's energy business supplies energy storage systems to data centers and the company plans to build its Terafab chip project, the associated policy uncertainties have heightened stock price volatility.
In addition, this sell-off occurred against the backdrop of a broader sharp correction in U.S. technology stocks. On November 5, the S&P 500 fell 4.36% as market risk appetite for AI capital expenditures, returns on data center investments, and high-valuation tech stocks diminished noticeably, putting concurrent pressure on Tesla as a high-valuation growth stock.
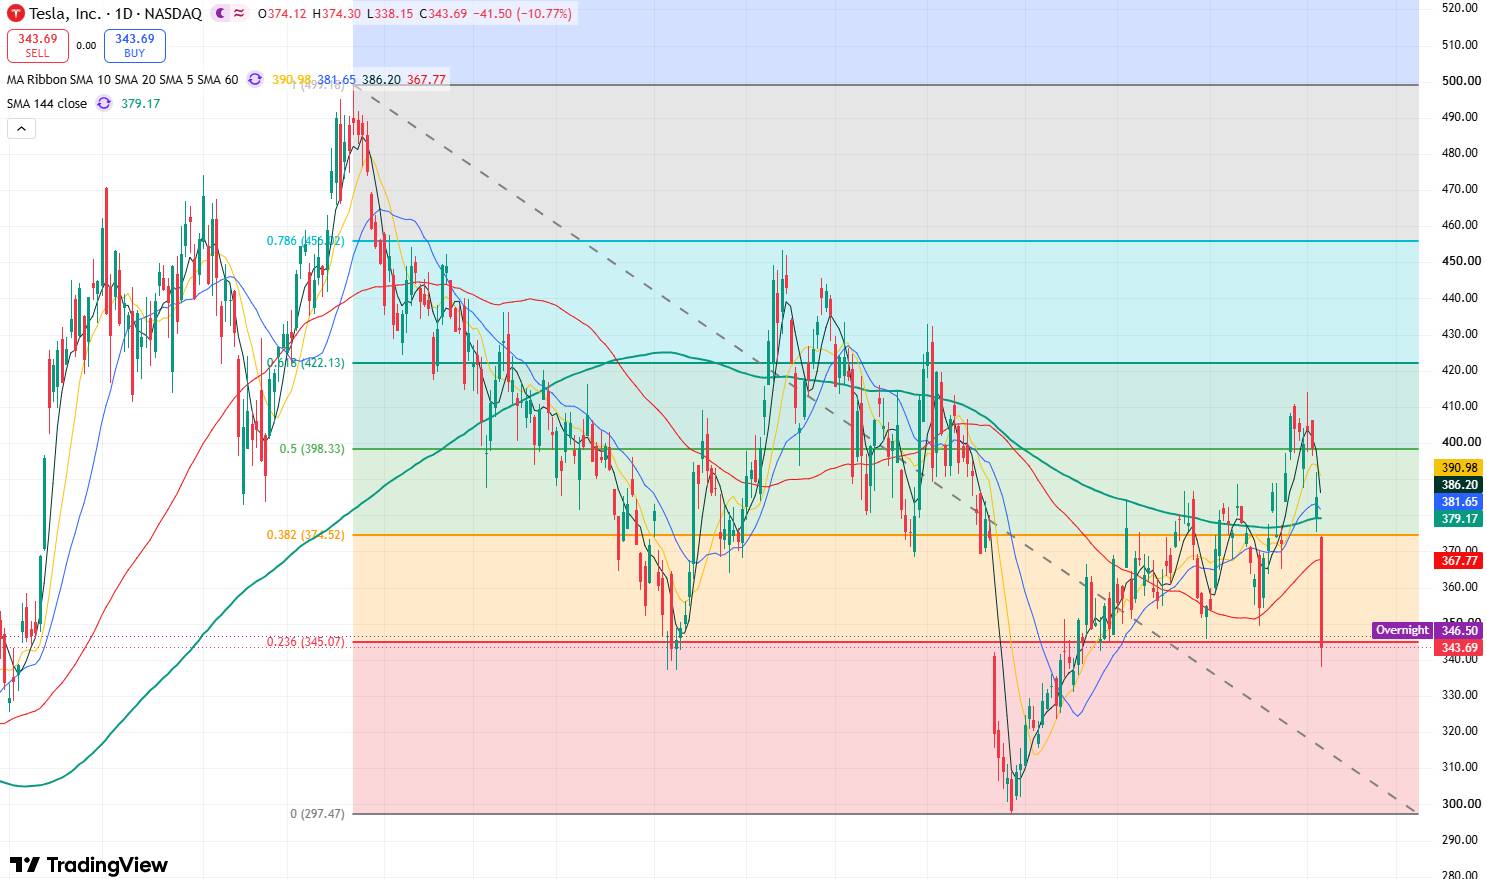
Tesla daily stock chart, Source: TradingView
Looking at Tesla's daily chart, amid Thursday's sharp decline, the stock broke directly below its 60-day and 144-day moving averages, while also breaching the key support level at $345. This has weakened the stock's short-term technical structure, further opening up downside room for a downward correction.
At present, with the stock breaking below the $345 support level, the downward momentum may continue in the near term. The primary downside target will be to test support at $330. If this level fails to hold, the stock could retreat further toward the $300 threshold, near its July low of $297.38.
On the upside, the initial resistance zone to watch is between $350 and $355. If the stock can break and hold above $355, it will test $365 to the upside, corresponding to resistance at the 60-day moving average.
This content was translated using AI and reviewed for clarity. It is for informational purposes only.
Recommended Articles












Comments (0)
Click the $ button, enter the symbol, and select to link a stock, ETF, or other ticker.