


Micron Stock Price Forecast: Shares Plunge Over 17% in Single Day to Near 6-Month Low, Risk Falling Below $500



AI Podcast


On November 5 ET, Micron shares plunged 17.46% to $656.39 amid broad semiconductor sector weakness, regulatory concerns over data center expansion, and a paused plant project in Taiwan. The stock has fallen over 30% from its October peak, breaking below key moving averages and forming a death cross. While the RSI indicates oversold conditions near 27.1, hinting at a potential technical rebound toward $700–$737.88 if the $650 support holds, the broader short-term trend remains bearish, with downside risks extending toward the $450–$500 range if support fails.

TradingKey - On November 5 ET, Micron (MU) shares tumbled, closing down 17.46% at around $656.39 after touching an intraday low of $650, marking a nearly six-month low. Trading volume surged to approximately 75 million shares, more than double its recent average. Since hitting $990 on October 28, Micron has pulled back more than 30% cumulatively and sequentially broken below multiple key moving averages, further expanding its short-term correction.
Micron's sharp drop yesterday was primarily driven by broad-based weakness across the AI and semiconductor sectors. Following the U.S. midterm elections, the market began focusing on potential tightening of approvals, as well as power and water restrictions, on data center construction in certain states. If the pace of data center construction slows, the growth momentum of demand for server DRAM, HBM, and enterprise storage could also be affected. Such concerns dragged memory stocks lower across the board, with SanDisk, SK Hynix, and others all recording double-digit declines yesterday.
In addition, news that Micron paused a memory chip plant construction project in Taiwan added to the stock's volatility. Meanwhile, although the recent continuous rise in memory prices benefits memory chipmakers' selling prices, it has also begun putting pressure on costs and demand for end-device manufacturers such as PC and smartphone makers, prompting the market to reassess the duration of the current memory upcycle.
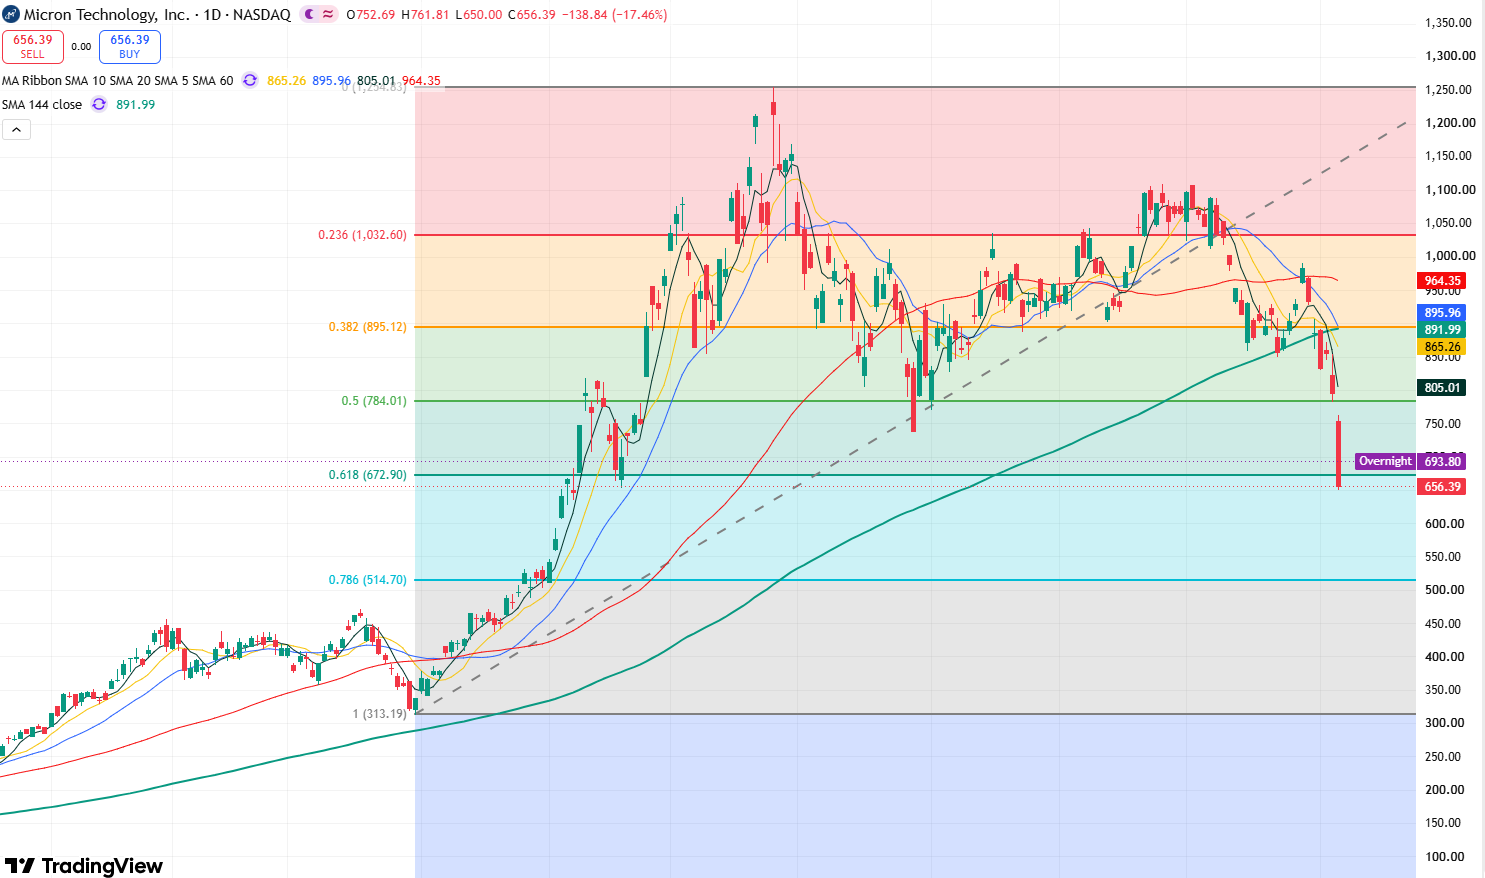
Micron Stock Price Daily Chart, Source: TradingView
Looking at Micron's daily chart, the stock broke below the July 29 low of $737.88 on Thursday, shifting the overall candlestick structure from high-level consolidation into a deeper downturn and significantly strengthening bearish market momentum. Meanwhile, the 5-day, 10-day, and 20-day moving averages sequentially crossed below the 144-day moving average, forming a death cross pattern and further reinforcing bearish momentum.
In terms of technical indicators, the Relative Strength Index (RSI) sits near 27.1, having entered oversold territory. Although further downside remains possible in the near term, yesterday's excessive decline suggests short-term selling pressure may be absorbed, increasing the likelihood of a rebound, as evidenced by the stock's after-hours gain yesterday.
Currently, the stock has dropped near the $650 support level. If this level fails to hold, the price may slide further toward the $500 mark, and could potentially break below it to test support in the $450-$470 range.
On the upside, if the stock halts its decline and stabilizes at the $650 support level, it could stage a technical relief rebound in the short term. The initial target for such a rebound would be testing $700-$737.88. If the stock breaks above $737.88 and continues upward, it could further fill yesterday's gap of $752-$795.
However, judging from the overall candlestick structure, even if the stock rebounds, its upside potential may be limited, with the short-term trend remaining tilted toward the downside.
This content was translated using AI and reviewed for clarity. It is for informational purposes only.
Recommended Articles










Comments (0)
Click the $ button, enter the symbol, and select to link a stock, ETF, or other ticker.