


Apple Stock Forecast: AAPL Slides as Memory Costs Squeeze Margins Despite a Record Revenue Guide



AI Podcast


Apple reported strong fiscal Q4 results and guided for record December-quarter revenue, driven by robust iPhone and Mac sales. However, the stock fell 2.81% in after-hours trading on Monday, November 2, as projected gross margins of 45% to 46% missed estimates due to surging memory costs and AI-related expenditures. Technically, the stock breached crucial support levels, turning the near-term outlook cautiously bearish. A daily close below $330.70 risks further downside toward $322.50, whereas a recovery above $339.06 would restore bullish momentum.
TradingKey - Apple (NASDAQ: AAPL) fell to $328.81 after hours on Monday, November 2, down 2.81%, after John Ternus's first earnings report as CEO. The stock had already dropped 1.83% to $338.32 in the regular session, and overnight trading near $329.73 left it just below $330.70 support.
The quarter beat estimates, and Apple guided to its biggest revenue quarter ever. But it also guided gross margin down to 45% to 46% as memory costs keep rising, and the stock fell as much as 4.43% to $323.33 during the call.
Fiscal Q4 Beat on Revenue and EPS
Revenue rose 12% to a September-quarter record of $114.5 billion, above the roughly $113.4 billion expected. EPS rose 14% to $2.10 against a $1.99 estimate, though tariff refunds added $0.05. Gross margin, the share of revenue left after production costs, was 47.9%, including about 1 point from those refunds. Fiscal 2026 revenue reached a record $479 billion.
iPhone and Mac Strong, Services Slower
iPhone revenue rose 17% to $57.6 billion and Mac jumped 24% to $10.8 billion. Services grew about 10% to $31.6 billion, an all-time high but in line with estimates and its slowest growth of the fiscal year. iPad and Wearables fell short of estimates, and Greater China revenue rose 21% to $17.5 billion but missed forecasts by about $1.2 billion, according to TheStreet Pro.
Record Revenue Guide, Weaker Margins
For the December quarter, Apple guided revenue growth of 7% to 10%, above the roughly 5.9% FactSet consensus. That implies about $153.8 billion to $158.1 billion, which would be Apple's best quarter ever. But gross margin is expected at 45% to 46%, below the roughly 47% Bloomberg estimate, and Services growth should slow to 8% to 9%.
CEO John Ternus said, "What we're seeing with memory pricing right now is unprecedented," and he expects memory costs to keep rising beyond the December quarter. Costs tied to the new Siri AI will also weigh on margins.
Apple Is Paying for the AI Boom Through Memory
Apple stayed out of the heavy AI data center spending that hurt Alphabet and Amazon last week, but AI demand has pushed up memory chip prices, and Apple buys huge amounts of memory for iPhones and Macs. Intel blamed the same squeeze for its PC slump. Price increases on some iPhones and MacBooks have offset only part of that cost, so margins are taking the hit.
Demand is not the issue. The iPhone Duo is still short of supply, and Ternus told Reuters, "Duo is constrained as of today." In my view, the key question is how long the memory squeeze lasts, because at about 36 times expected earnings over the next 12 months, the stock has little room for a longer margin decline.
Apple Technical Analysis: Daily Close Below $330.70 Could Open $322.50
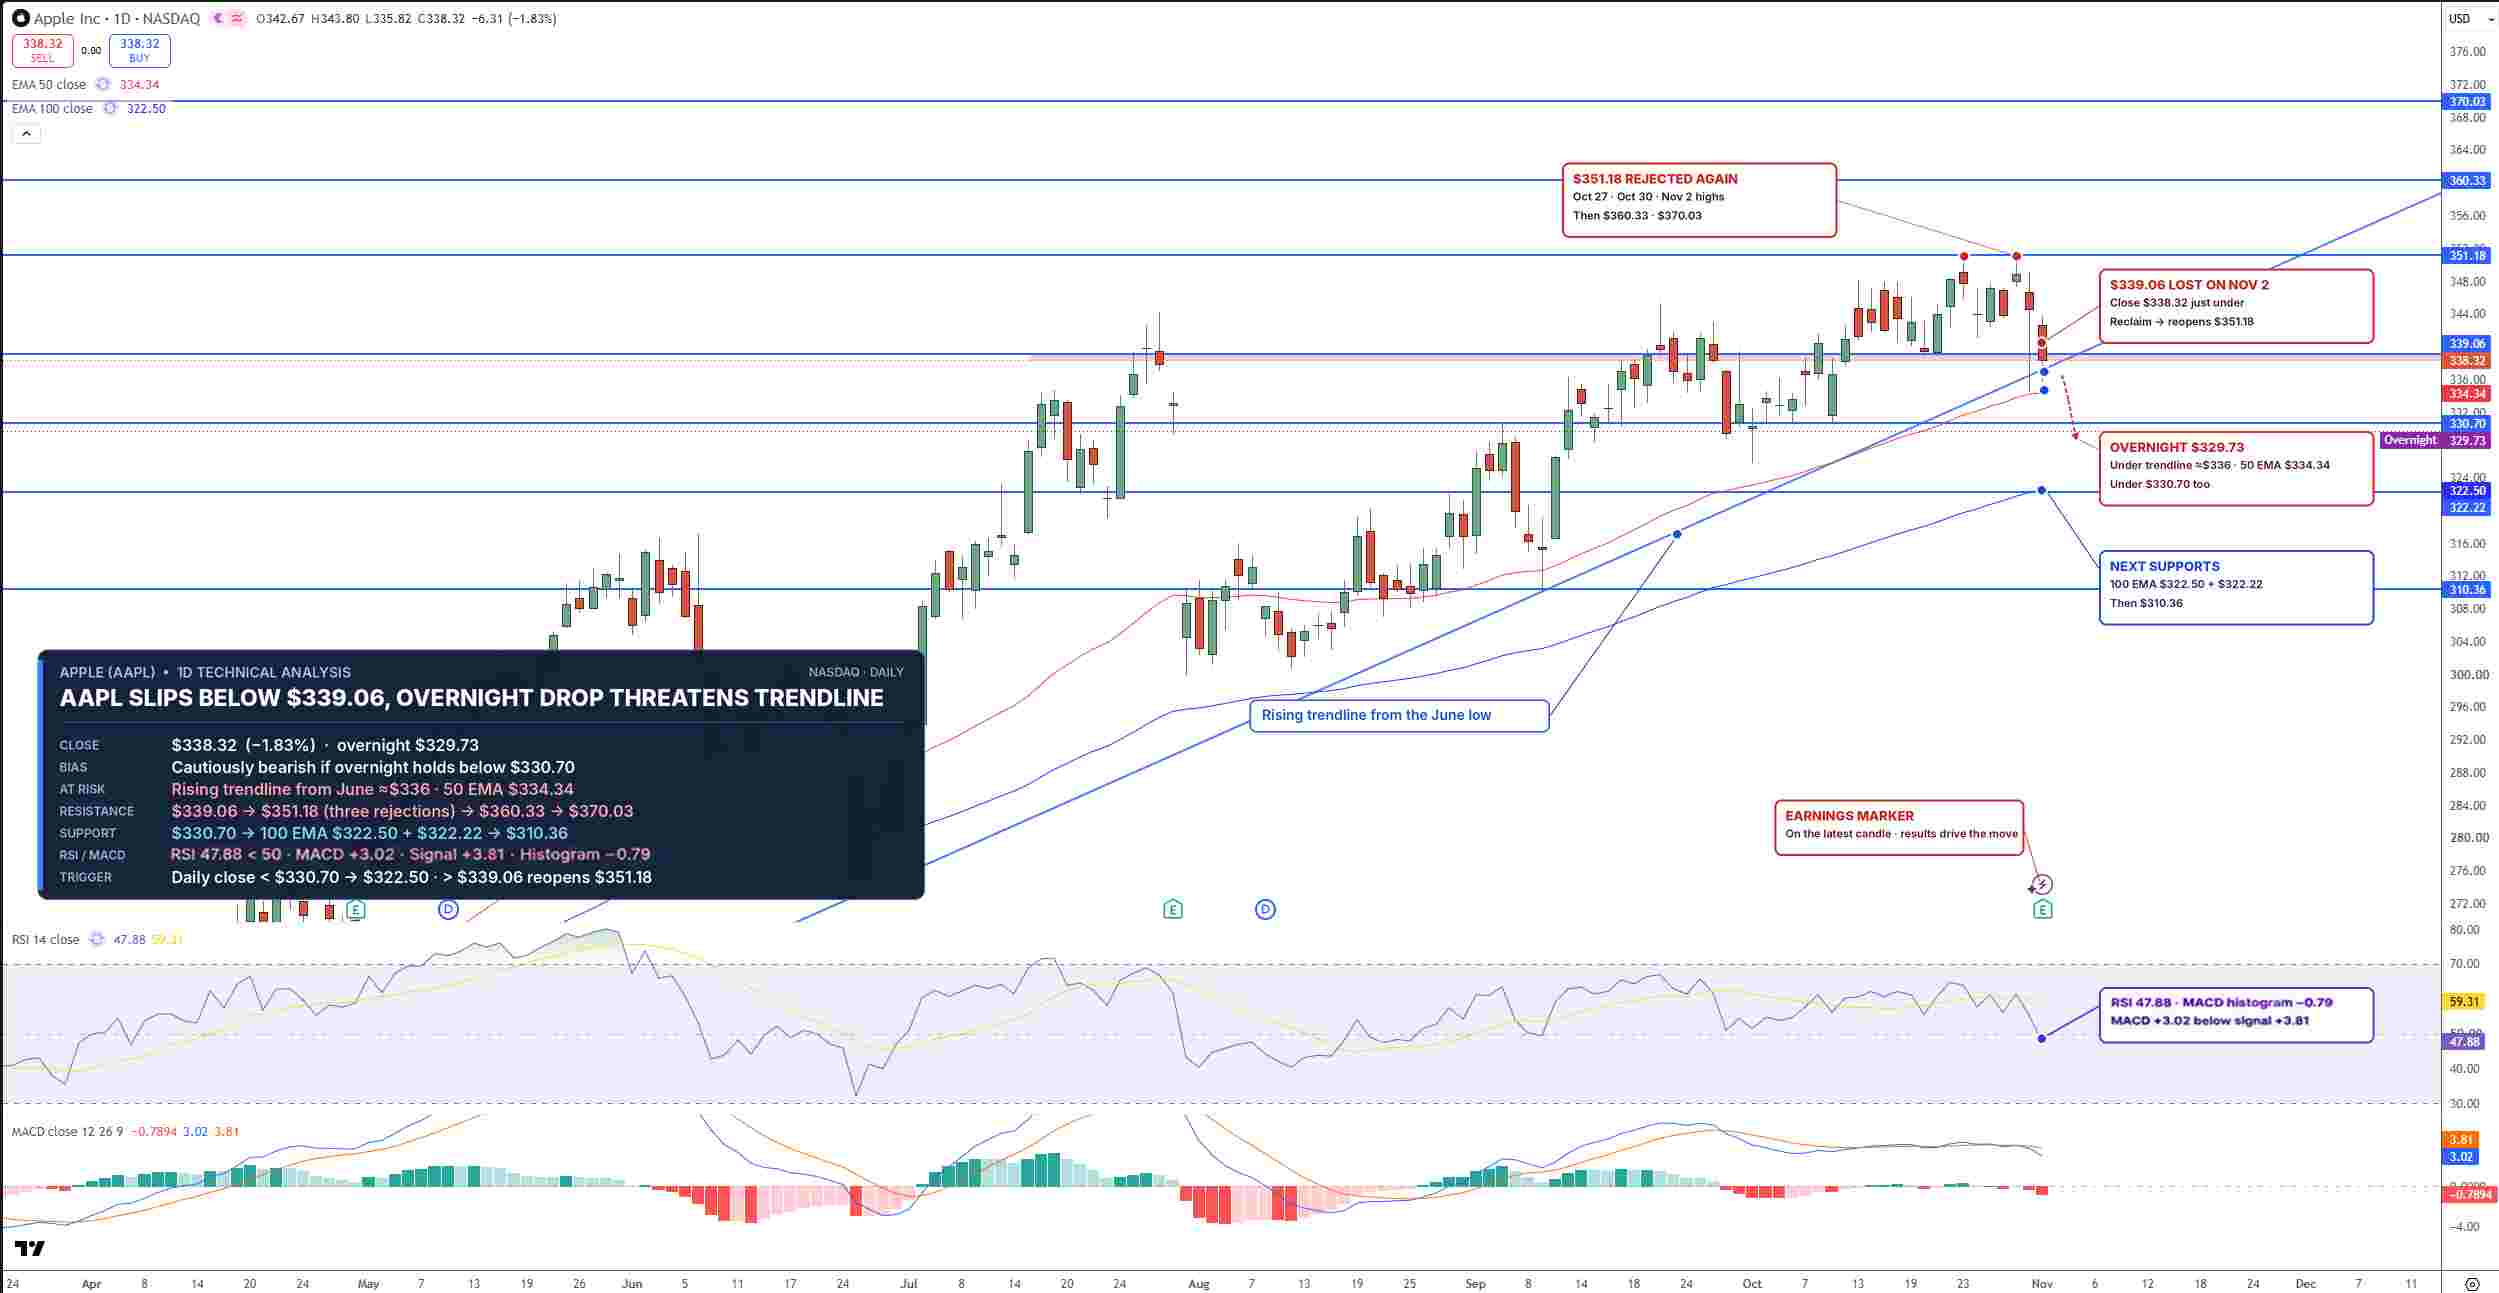
The selling shows clearly on the daily chart. AAPL failed again at $351.18 and closed Monday at $338.32. If the overnight drop holds, the stock will break below the rising trendline from June, a line drawn under its higher lows, and the 50-day EMA at $334.34, the first real crack in the uptrend in months. EMAs are moving averages that give more weight to recent prices.
RSI, a momentum gauge that runs from 0 to 100, has slipped to about 48, below the neutral 50 line. The MACD line remains positive at 3.02 but sits below its 3.81 signal line. The histogram is negative at −0.79, suggesting momentum has shifted toward sellers. Last Thursday, before the report, RSI was still above 60.
AAPL Price Chart - Source: Tradingview
A daily close below $330.70 could send AAPL toward the 100-day EMA near $322.50, then $310.36. For buyers, a recovery above $339.06 would repair the damage and reopen $351.18.
I'm cautiously bearish if the overnight weakness holds below $330.70, while reclaiming $339.06 would restore the bullish outlook.
Key Levels
- Last close: $338.32, down 1.83% on Monday, November 2 (after hours: $328.81)
- Support: $330.70, $322.50, $310.36
- Resistance: $334.34, $339.06, $351.18
- RSI: 47.88, below the 50 midline
- Bullish trigger: Daily close above $339.06
- Bearish trigger: Daily close below $330.70
FAQs
Why did Apple stock fall after earnings?
Apple fell 2.81% after hours because it guided December-quarter gross margin to 45% to 46%, below expectations, as memory costs keep rising, even though Q4 revenue and EPS beat estimates and it forecast record revenue.
What is the Apple stock forecast now?
The bias is cautiously bearish if AAPL holds below $330.70 on the daily chart. A daily close below $330.70 could open $322.50 and $310.36, while a recovery above $339.06 would reopen $351.18.
Bottom Line
Apple's sales engine is working, with a record revenue guide and iPhone Duo demand running ahead of supply, but memory costs are now eating into margins. The level that matters is $330.70. I expect pressure toward $322.50 if the stock closes below it, while a move back above $339.06 would show buyers are willing to look past the margin squeeze.
Recommended Articles









Comments (0)
Click the $ button, enter the symbol, and select to link a stock, ETF, or other ticker.