


Intel Plunges 30% in Worst Single-Day Performance Since 1974, and Historical Data Shows Just a 47.8% Win Rate for Buying Now



AI Podcast


Intel shares plunged over 30% following Q3 earnings, driven by a weak Q4 outlook, declining PC shipments, and surging capital expenditures. Major investment banks downgraded the stock and lowered price targets, reflecting valuation concerns and projected negative free cash flow through 2027. Furthermore, historical data indicates that buying the dip offers a low win rate of 47.8% over a 60-day holding period, suggesting continued downside risk and delayed shareholder returns amid heavy manufacturing investments.
TradingKey - Intel (INTC) fell more than 30% in early trading after releasing its third-quarter financial results. If the decline holds until the market close, it could mark its worst single-day performance since 1974. Furthermore, historical data suggests that now is not a good time to buy.
Although the chipmaker's third-quarter profit beat expectations, increased capital expenditure and a weaker fourth-quarter outlook still led investors to re-evaluate its appropriate valuation. It is reported that from the beginning of this year to its high on July 1, INTC's stock price surged from $37.76 to a peak of $142.35, representing a gain of as much as approximately 277%.
Following the earnings release, JPMorgan maintained its Neutral rating and lowered its price target from $85 to $80; BofA Securities downgraded its rating from Buy to Neutral and cut its price target from $145 to $100.
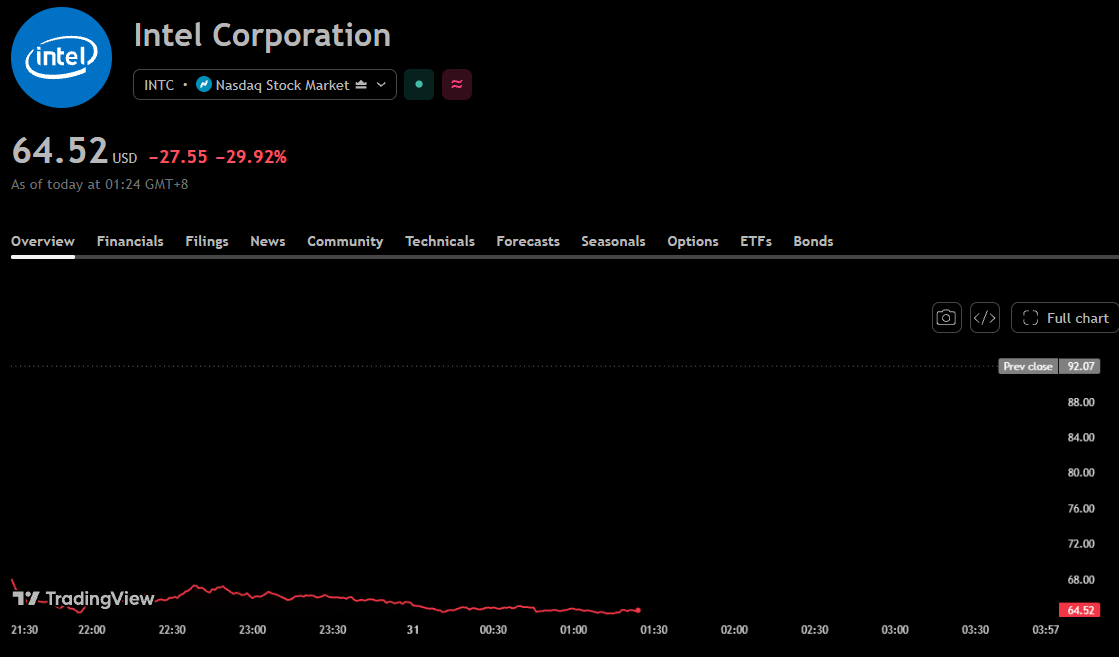
Intel stock price chart, Source: TradingView
The drag on performance mainly came from the PC business. BofA expects Intel's fourth-quarter PC shipments to decline 25% to 30% quarter-over-quarter. Management projects the overall PC system market to shrink 12% in 2026 and drop another 10% in 2027, with customer inventory adjustments continuing at least into the first quarter of 2027.
While profitability is under pressure, Intel still needs to step up its manufacturing investments. Management expects capital expenditure in 2027 to grow strongly from the baseline of $20 billion in 2026. JPMorgan considers more than $26 billion to be a reasonable assumption and forecasts a negative free cash flow of $6.6 billion in 2027. Although INTC held about $54 billion in cash and cash equivalents at the end of the quarter, providing a buffer, ongoing investments mean shareholders will have to wait longer to see cash returns.
Historical performance also does not support the view that buying after a plunge offers a higher probability of success.
As of October 29, 2026, Intel has experienced 23 instances since 2000 where its single-day closing loss exceeded 10%. Buying at the closing price on the day of the plunge and holding for 60 trading days yielded a positive return in only 11 instances, representing a historical winning rate of 47.8%, while the stock continued to decline in the other 12 instances.
Historical Plunge Date | Single-Day Closing Gain/Loss | Return 20 Trading Days Later | Return 60 Trading Days Later |
2000/9/22 | -22.03% | -10.20% | -30.60% |
2000/10/16 | -11.61% | 7.00% | -6.50% |
2000/11/10 | -10.57% | 1.20% | -6.40% |
2000/11/30 | -10.96% | -21.00% | -25.00% |
2000/12/1 | -10.34% | -9.00% | -14.70% |
2000/12/6 | -11.81% | 1.00% | -0.80% |
2001/3/9 | -11.47% | -19.70% | 1.00% |
2002/6/7 | -18.52% | -15.90% | -27.90% |
2002/10/16 | -18.04% | 33.80% | 28.40% |
2004/7/14 | -10.56% | -5.20% | -9.20% |
2006/1/18 | -11.44% | -5.50% | -13.90% |
2008/1/16 | -12.38% | 2.90% | 4.10% |
2008/9/29 | -10.05% | -17.50% | -18.50% |
2020/3/12 | -11.85% | 25.50% | 39.80% |
2020/3/16 | -18.04% | 36.00% | 43.20% |
2020/7/24 | -16.24% | -2.60% | 7.90% |
2020/10/23 | -10.58% | -5.80% | 29.60% |
2021/10/22 | -11.68% | 0.10% | 8.40% |
2024/1/26 | -11.91% | -1.50% | -21.50% |
2024/8/2 | -26.06% | 2.60% | 6.70% |
2025/4/4 | -11.50% | 2.10% | 10.20% |
2026/1/23 | -17.03% | -3.20% | 47.00% |
2026/6/5 | -11.28% | 11.30% | -10.30% |
It should be noted that these samples include sharp drops triggered by earnings reports as well as other reasons; in 8 of these instances, holding losses even exceeded 10%.
This content was translated using AI and reviewed for clarity. It is for informational purposes only.
Recommended Articles









Comments (0)
Click the $ button, enter the symbol, and select to link a stock, ETF, or other ticker.