


Amazon Shares Plunge 11% After Hours as Q3 Revenue Misses Estimates, Free Cash Flow Negative $33.456 Billion



AI Podcast


Amazon reported third-quarter 2026 financial results with mixed performance. Total revenue reached $201.944 billion, slightly missing expectations, while net income declined year-over-year due to prior-period investment gains. AWS revenue grew 39.3% to beat estimates, and consolidated operating margins hit a record 13.9%. However, advertising revenue underperformed, and heavy AI infrastructure investments drove trailing 12-month free cash flow to negative $42.357 billion. Looking to the fourth quarter, Amazon projects revenue between $240 billion and $247 billion, with operating income expected to reach up to $33.5 billion, reflecting continued growth momentum amid high capital expenditures.

TradingKey - On October 29, Amazon (AMZN) reported its third-quarter 2026 financial results. AWS revenue growth accelerated further and beat market expectations, while the group's operating margin reached a record high. However, total revenue fell slightly short of expectations, advertising revenue came in below expectations, and AI infrastructure investments continued to widen the free cash flow gap.
The stock price dropped over 11% at one point in after-hours trading. As of press time, the decline narrowed to 5.39%, trading at $230.64.
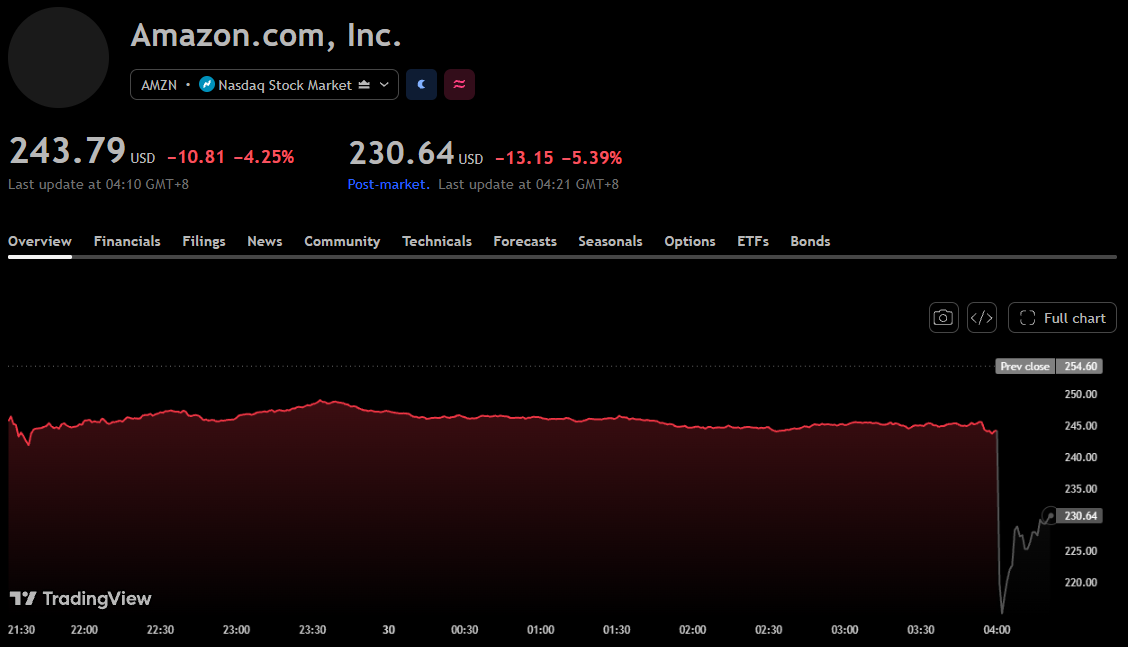
Amazon stock price chart, Source: TradingView
Amazon Third-Quarter Revenue Misses Estimates as Net Income Drops Year-Over-Year
In the third quarter, Amazon reported revenue of $201.944 billion, up 12% year-over-year, which was $366 million below the market consensus estimate of $202.310 billion, or 0.18% below expectations; excluding the impact of foreign exchange fluctuations, revenue grew 13%. The company specifically noted that Prime Day events in most major markets were moved to the second quarter this year, whereas last year they occurred entirely in the third quarter.
AWS was a key highlight this quarter, with revenue reaching $45.984 billion, up 39.3% year-over-year, accelerating further from approximately 37% in the previous quarter and topping market expectations of 38%. Compared with the revenue expectation of $45.480 billion reported by StreetAccount, actual revenue came in $504 million higher, or 1.11% above estimates. AWS operating income stood at $17.773 billion, up 55% year-over-year; its operating margin was 38.7%, up from 34.6% in the same period last year, but down from 39.4% in the previous quarter.
Meanwhile, the advertising business underperformed expectations, posting revenue of $19.637 billion, an 11% year-over-year increase, which fell $1.183 billion short of the market consensus of $20.820 billion, or 5.68% below expectations; growth was 12% excluding foreign exchange impacts. The company stated that advertising growth was affected by Prime Day and other timing factors, and it expects fourth-quarter advertising revenue growth to rebound to nearly 20% year-over-year.
In the retail business, North America revenue reached $112.852 billion, up 6% year-over-year, with operating income increasing from $4.789 billion to $8.723 billion; International segment revenue was $43.108 billion, up 5% year-over-year or 8% FX-neutral, with operating income rising from $1.199 billion to $1.580 billion. Together, AWS and the retail operations drove consolidated operating income up 61% year-over-year to $28.076 billion, pushing the operating margin to a record high of 13.9%, up from 9.7% in the prior-year period.
However, operating income growth did not translate into a parallel rise in net income. GAAP net income for the quarter was $20.685 billion, down 2% year-over-year, while diluted earnings per share fell 3% to $1.89. The company attributed the decline in net income primarily to a $9.5 billion pre-tax gain on its Anthropic investment included in the prior-year period. The income statement shows that non-operating items shifted from net income of $10.748 billion in the prior-year period to a net expense of $1.207 billion this quarter, which included interest expense of $1.691 billion.
Third-Quarter Free Cash Flow Posts Negative $33.456 Billion
Cash flow pressure stemmed primarily from expanding capital investments. For the trailing 12 months ended Sept. 30, operating cash flow reached $168.3 billion, up 29% year-over-year. Net purchases of property and equipment, after deducting proceeds from asset sales and incentives, totaled $210.657 billion, up 82% year-over-year, which the company noted mainly reflected AI investments. Consequently, trailing 12-month free cash flow dropped to negative $42.357 billion, compared with positive $14.788 billion for the prior-year period and negative $7.604 billion for the trailing 12 months as of the end of the previous quarter.
For the third quarter alone, operating cash flow stood at $42.422 billion. Cash outflows for property and equipment purchases were $77.259 billion, resulting in net purchases of $75.878 billion after deducting $1.381 billion in proceeds from sales and incentives. Calculated according to the company's definition, single-quarter free cash flow came in at negative $33.456 billion.
The company also maintained its expectation for full-year 2026 cash capital expenditures of approximately $220 billion. Long-term debt financing inflows reached $48.102 billion in the third quarter, with long-term debt on the balance sheet standing at $173.125 billion at quarter-end, reflecting capital demand during its expansion phase.
Looking ahead to the fourth quarter, Amazon expects revenue of $240 billion to $247 billion, representing year-over-year growth of 12% to 16%, with a midpoint of $243.5 billion. Operating income is projected to be between $28.5 billion and $33.5 billion, with a midpoint of $31 billion, compared with approximately $25 billion in the prior-year period.
This content was translated using AI and reviewed for clarity. It is for informational purposes only.
Recommended Articles






Comments (0)
Click the $ button, enter the symbol, and select to link a stock, ETF, or other ticker.