


Amazon Stock Forecast: AMZN Needs a Close Above $258 as Q3 Tests Its AI Spending



AI Podcast


Amazon reports its third-quarter results on Thursday, October 29, with Wall Street anticipating $202.3 billion in revenue and $1.96 EPS. While AWS demand remains exceptionally strong with capacity sold out through 2027, aggressive AI-driven capital expenditures have turned trailing free cash flow negative. Investors will closely scrutinize upcoming capex guidance and monetization. Technically, the stock is trading neutrally within a triangle pattern. A daily close above $258.12 signals a bullish breakout targeting $267.47, whereas a drop below the $244.58 support level risks a decline toward $235.25.

TradingKey - Amazon (NASDAQ: AMZN) rose 0.59% to $254.60 on Wednesday, October 28, and premarket quotes on Thursday, October 29, sat slightly lower near $252.01. The company reports third-quarter results after the US close on Thursday, October 29, with the stock about 11% below its 52-week high of $287.20.
Amazon reports after two very different Big Tech reactions. Microsoft gained after hours on Wednesday after beating EPS and revenue estimates, while Alphabet fell sharply after missing on both and reporting negative free cash flow. Investors will judge Amazon on the same question: is AI spending turning into cash?
What Wall Street Expects
Analysts expect revenue of about $202.3 billion, up about 12% and just above the top of Amazon's $197 billion to $202 billion guide. The EPS consensus is about $1.96, against $1.95 a year ago, but estimates range widely from $1.72 to $2.32. Amazon guided operating income, the profit from its core businesses, to $22.5 billion to $26.5 billion. AWS revenue is expected near $45.6 billion.
Reported EPS could land far from consensus because Amazon's results include gains or losses on its investment in Anthropic. In the second quarter, $53.4 billion of non-operating income, mostly from Anthropic, lifted EPS to $5.75.
AWS Is Sold Out
AWS, Amazon's cloud business, is the main driver of the stock. In the second quarter, its revenue rose 37% to $42.2 billion and operating income climbed to $16.6 billion from $10.2 billion, a margin of about 39%. Its AI business passed a $25 billion annual revenue run rate, growing at triple digits.
On October 23, CEO Andy Jassy said AWS capacity is sold out for 2026, largely sold out for 2027, with a substantial part of 2028 committed. That shifts the question from demand to how fast Amazon can add data centers, and how much it must spend to do so.
Spending Has Turned Free Cash Flow Negative
Trailing free cash flow, the cash left after operating costs and capital spending over the past 12 months, was an outflow of $7.6 billion as of June, against an inflow of $18.2 billion a year earlier. Operating cash flow rose 33% to $161.4 billion over the same period, but a $66.1 billion jump in spending on property and equipment, mostly for AI, more than used it up.
Amazon's 2026 capex guide, the money it plans to spend on data centers and equipment, stands at about $220 billion. After the October 28 split between Microsoft and Alphabet, any increase to that guide, or a large 2027 signal, will decide which side Amazon lands on.
Retail and Advertising
North America revenue grew 16% to $116.2 billion in the second quarter, and advertising revenue grew 26%. Amazon will also give its first official read on the holiday quarter, usually its biggest quarter for retail sales.
Valuation and Analysts
Amazon trades at about 20 times trailing earnings, a figure flattered by the Anthropic gains. Analysts remain positive, with a Strong Buy consensus from 60 analysts and an average target of about $332, roughly 30% above Wednesday's close.
Amazon Technical Analysis: Daily Close Above $258.12 Could Open $267.47
That wait for results shows clearly on the daily chart. AMZN is trading inside a triangle, with a falling trendline from the August high above and a rising trendline from the July low below, so each swing is getting smaller as the earnings date nears. Price sits right on both moving averages, which track the average price over a set period, so the market is undecided.
RSI, a momentum gauge that runs from 0 to 100, sits at about 50, its neutral midpoint.
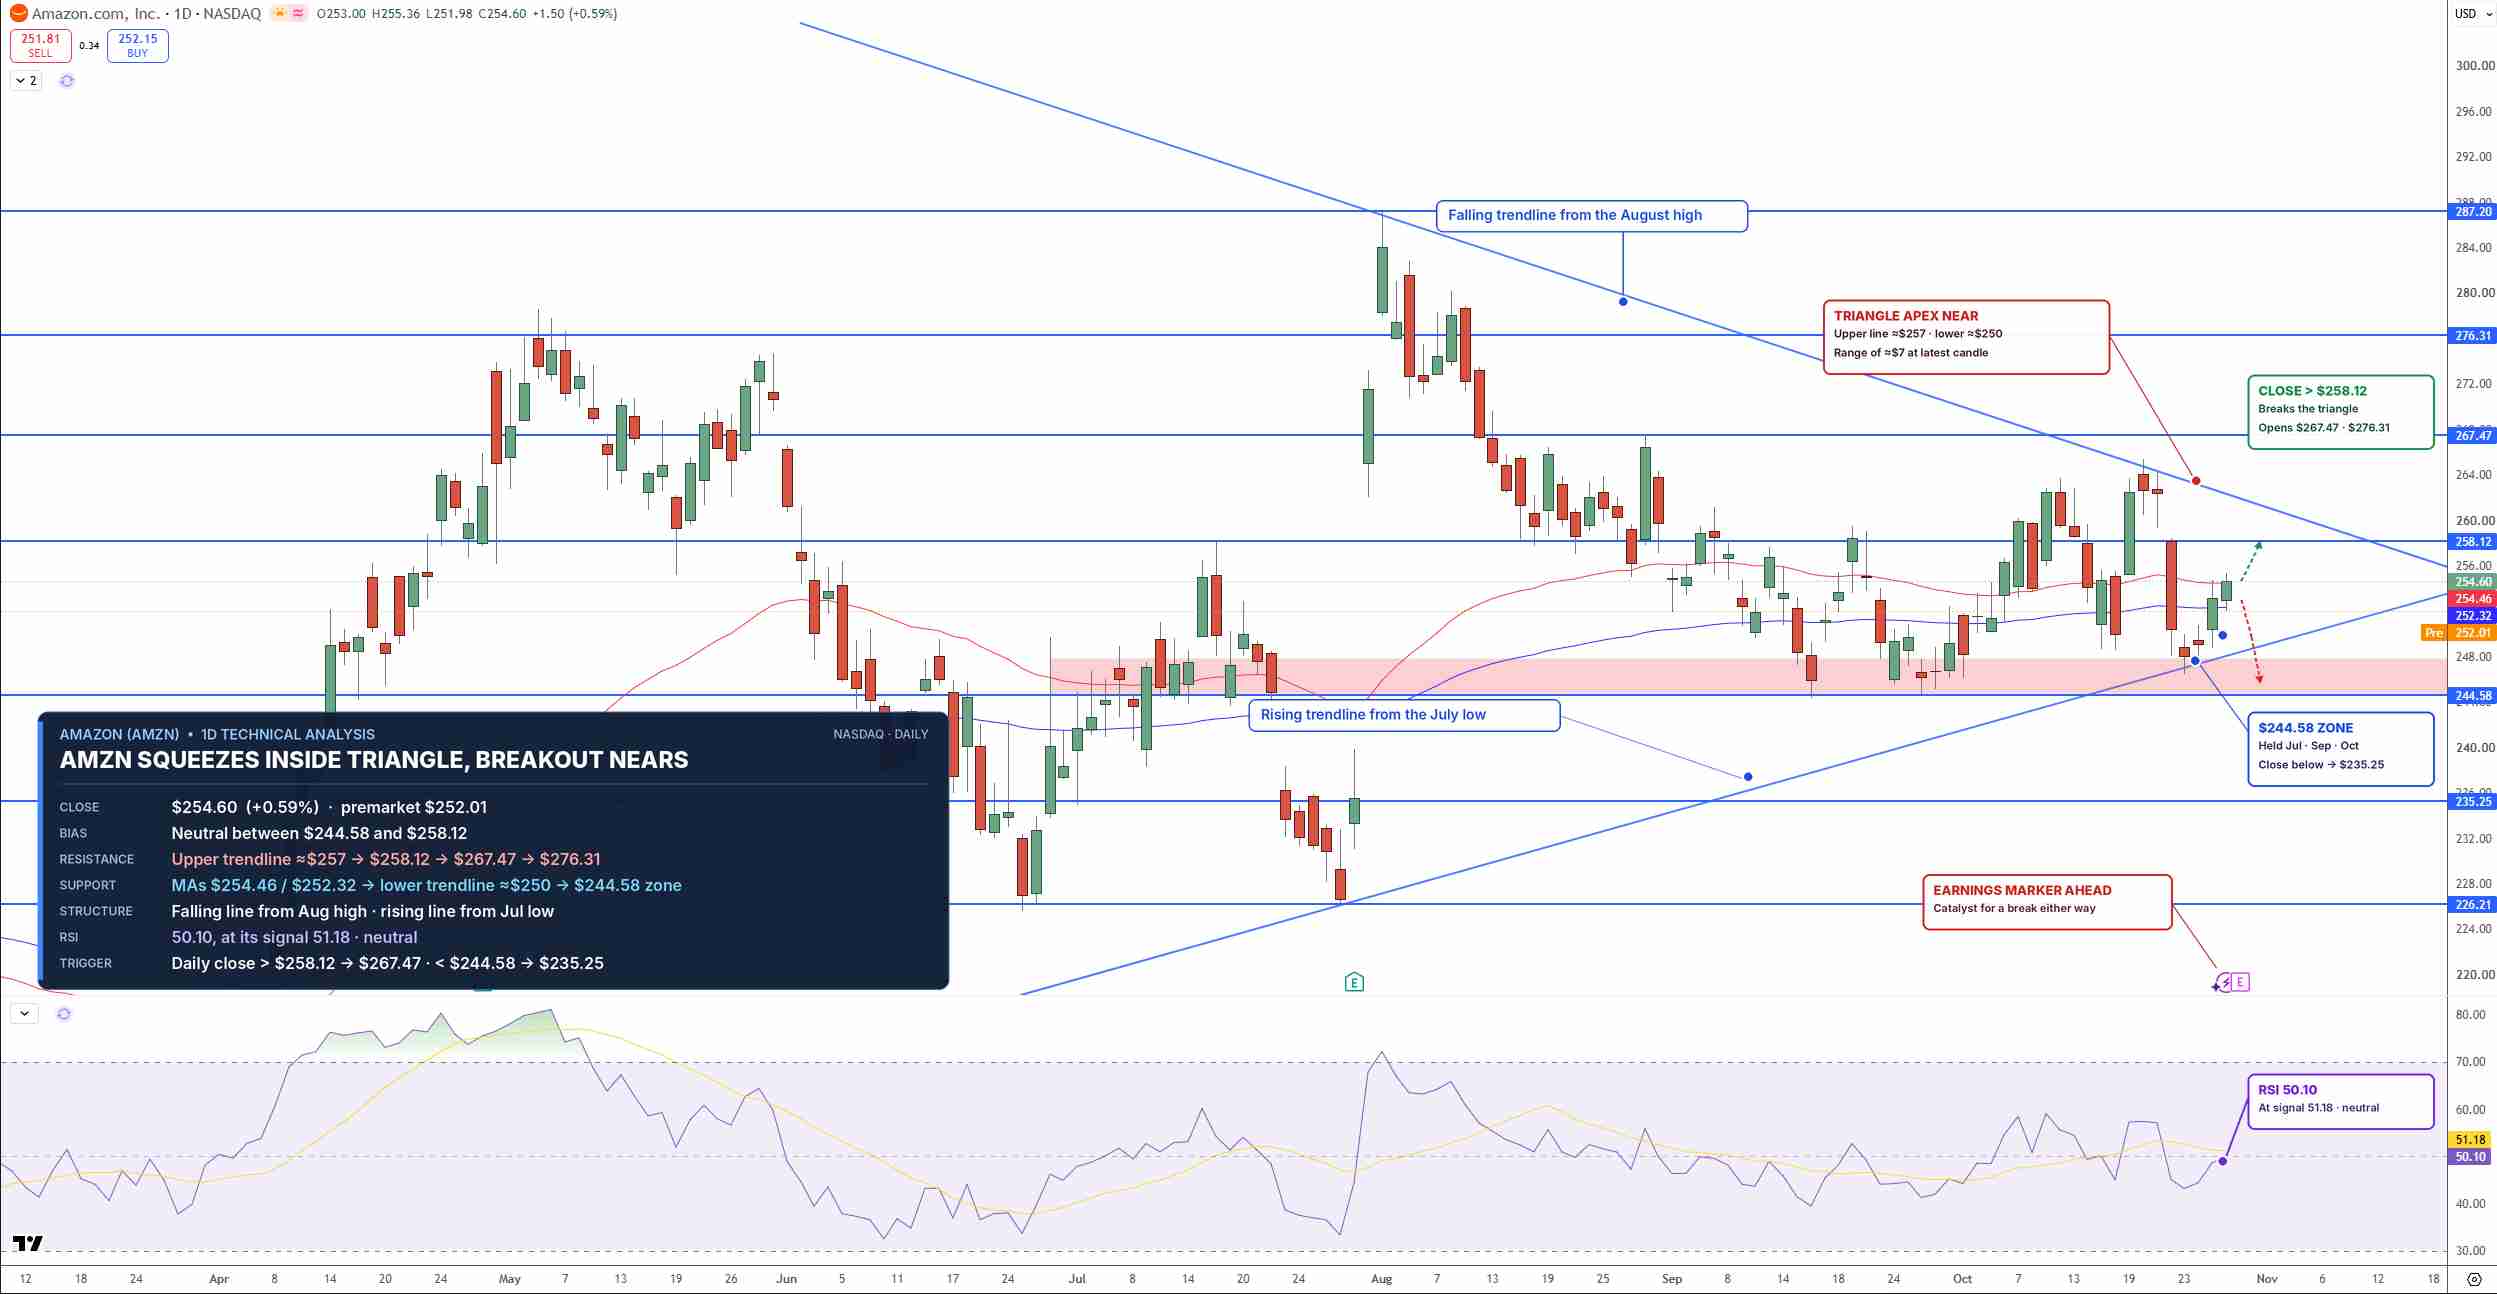
AMZN Price Chart - Source: Tradingview
A daily close above $258.12 would break the triangle higher and could open $267.47, followed by $276.31. On the downside, the $244.58 zone is key support, close to the $245 area that IG also flags. A close below it could send AMZN toward $235.25.
I'm neutral while AMZN trades between $244.58 and $258.12, and a breakout above $258.12 would turn the outlook bullish.
Key Levels
- Last close: $254.60, up 0.59% on October 28
- Support: $254.46, $252.32, $244.58, $235.25
- Resistance: $258.12, $267.47, $276.31
- RSI: 50.10, neutral
- Bullish trigger: Daily close above $258.12
- Bearish trigger: Daily close below $244.58
FAQs
What is expected from Amazon's Q3 2026 earnings?
Analysts expect revenue of about $202.3 billion and EPS of about $1.96, with AWS revenue near $45.6 billion. Investors will focus on AWS growth, the $220 billion capex guide and free cash flow.
What is the Amazon stock forecast?
The bias is neutral between $244.58 and $258.12 on the daily chart. A daily close above $258.12 targets $267.47 and $276.31, while a close below $244.58 opens $235.25.
Bottom Line
AWS demand is not the issue, since capacity is sold out. The question is how much Amazon must spend, and whether cash flow can keep up. The level that matters is $258.12. In my view, a daily close above it after the report would break the triangle higher, while a daily close below $244.58 would open $235.25.
Recommended Articles









Comments (0)
Click the $ button, enter the symbol, and select to link a stock, ETF, or other ticker.