


Alphabet Shares Plunge 8% After Hours as Q3 Revenue, Net Income Miss Estimates, Free Cash Flow Hits Negative $9.065 Billion



AI Podcast


Alphabet reported Q3 2026 revenue of $127.577 billion, up 25% year-over-year, driven by a 103% surge in Google Cloud revenue. However, total revenue missed market estimates by 0.49%. Adjusted EPS of $2.12 fell substantially below the $3.02 consensus due to equity investment losses. Capital expenditures surged to $51.355 billion, resulting in a negative free cash flow of $9.065 billion for the second consecutive quarter. Consequently, Alphabet's stock plummeted over 8% in after-hours trading to $298.68.

TradingKey - On October 28, Google parent Alphabet (GOOGL) (GOOG) reported its Q3 2026 financial results. Doubling Google Cloud revenue drove a 25% increase in group revenue and a 30% growth in operating profit. However, total revenue fell slightly short of market expectations, losses from securities investments dragged on net profit, and expanding capital expenditures kept free cash flow negative for a second consecutive quarter.
As of press time, Google's stock plummeted over 8% in after-hours trading to $298.68.
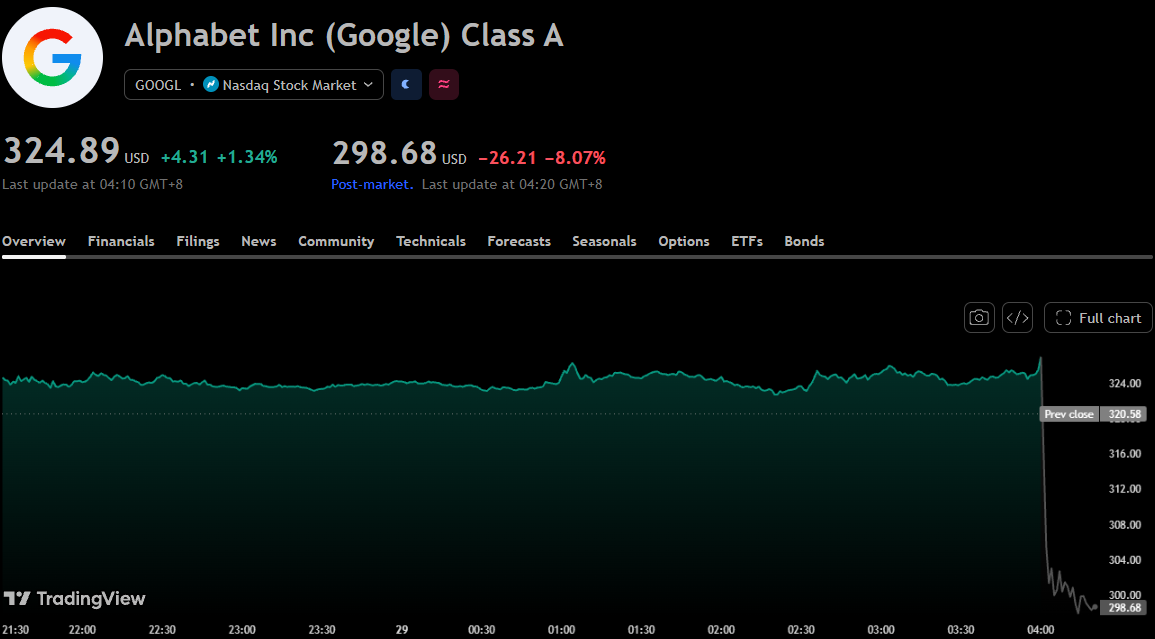
Google stock chart, Source: TradingView
Alphabet Third-Quarter Revenue Misses Estimates by 0.49%
Alphabet's third-quarter revenue reached $127.577 billion, up 25% year-over-year, or 25% on a constant currency basis, marking its 13th consecutive quarter of double-digit revenue growth. Compared to the market expectation of $128.200 billion, actual revenue was $623 million lower, coming in 0.49% below expectations; the year-over-year growth rate disclosed by the company was consistent with the 25% expected by the market.
Google Cloud remained a major growth driver, with revenue reaching $30.709 billion, up 103% year-over-year. The company attributed the growth to demand for enterprise AI infrastructure, AI solutions, and core Google Cloud Platform services, while pointing out that sales of TPU systems also made a significant contribution to revenue growth. Operating income for the cloud business increased from $3.594 billion in the same period last year to $11.121 billion.
Google Services revenue reached $96.302 billion, up 11% year-over-year. Among this, Search & other revenue was $63.350 billion, up 12% year-over-year; YouTube ads revenue was $11.207 billion; and subscriptions, platforms, and devices revenue was $14.290 billion. Operating income for Google Services rose from $33.527 billion to $39.157 billion.
Alphabet Adjusted EPS of $2.12 Substantially Below Market Estimate of $3.02
During the period, Alphabet's operating income reached $40.576 billion, up 30% year-over-year, with an operating margin of 31.8%.
However, the growth in operating income failed to drive a corresponding increase in net income: GAAP net income came in at $26.468 billion, and after deducting preferred stock dividends of $298 million, net income available to common shareholders stood at $26.170 billion, down from $34.979 billion in the same period last year. Diluted earnings per share was $2.12, compared to $2.87 in the prior-year period and below market expectations of $3.02.
Profits were significantly impacted by a reversal in gains and losses on securities investments. Net other expense for the quarter was $8.221 billion, compared to net other income of $12.759 billion in the same period last year.
Among this, equity securities shifted from a net gain of $10.734 billion in the prior-year period to a net loss of $8.664 billion. This item includes both realized and unrealized gains and losses, and cannot be entirely characterized as unrealized losses. The company disclosed that the losses on equity securities reduced income tax expense by approximately $1.900 billion for the quarter, while reducing net income by approximately $6.700 billion and diluted earnings per share by $0.55.
Free Cash Flow Negative for Second Consecutive Quarter
Capital expenditures and cash flow were another area of focus. Purchases of property and equipment in the third quarter came to $51.355 billion, up approximately 114.4% year-over-year based on financial report data, which was below the analyst expectation of $55.200 billion shown by FactSet, with spending coming in $3.845 billion lower, or 6.97% below expectations.
However, operating cash flow dropped from $48.414 billion in the same period last year to $42.290 billion, failing to cover capital expenditures. Consequently, free cash flow was negative $9.065 billion, declining further from negative $5.855 billion in the previous quarter. Compared with the analyst forecast of negative $2.270 billion, free cash flow outflow for the quarter was $6.795 billion higher.
This content was translated using AI and reviewed for clarity. It is for informational purposes only.
Recommended Articles











Comments (0)
Click the $ button, enter the symbol, and select to link a stock, ETF, or other ticker.