


Amazon Holds Key $250 Level Ahead of Earnings; Beat Could Test $280 Record High



AI Podcast


Amazon will report Q3 2026 financial results after the U.S. market close on October 29, with revenue projected at approximately $202.2 billion and EPS at $1.96 to $1.97. AWS remains the core growth catalyst, with expected revenue of $45.4 billion to $45.6 billion and an operating margin near 37.3%. However, investors are closely monitoring high capital expenditures of around $220 billion directed toward AI and data center infrastructure, alongside free cash flow returns. Technically, the stock trades near $254.60, with resistance at $255–$258 and key support at $248–$250, awaiting earnings guidance for a definitive breakout direction.

TradingKey - Amazon (AMZN) will report its third-quarter 2026 financial results after the U.S. market close on October 29. Ahead of the earnings release, the stock closed at $254.60, continuing to fluctuate around the $250 to $260 range. If AWS growth, profit margins, and Q4 guidance all beat expectations, the stock is expected to break out of the current consolidation range and retest highs around $280.
The market expects Amazon's third-quarter revenue to be approximately $202.2 billion, up about 12% year-over-year, coming in at the upper end of the company's previous guidance range of $197 billion to $202 billion. Earnings per share are expected to be around $1.96 to $1.97. The company previously projected quarterly operating income of $22.5 billion to $26.5 billion, while market forecasts are close to $26.2 billion, indicating that investors already have high expectations for profitability.
AWS remains the core business driving the post-earnings stock direction. Analysts expect the segment's quarterly revenue to be approximately $45.4 billion to $45.6 billion. Driven by enterprise cloud migration, generative AI services, and cloud computing demand, its growth rate is expected to accelerate further. The market also expects AWS's operating margin to reach around 37.3%, higher than previous forecasts. If actual revenue and profit margins both beat expectations, it will demonstrate that AI demand is not only generating orders but also translating into higher-quality earnings.
However, strong demand for AWS comes with higher investment. Amazon is expected to invest approximately $220 billion in capital expenditures this year, with most allocated to data centers, chips, and cloud computing infrastructure. Management previously stated that part of AWS's capacity for the next few years has already been booked by customers, and even with such a massive investment scale, the company may still be unable to meet all demand. Consequently, investors are focusing not only on revenue growth, but also scrutinizing free cash flow, capital expenditure plans, and whether newly added computing capacity can deliver adequate returns.
Beyond cloud computing, the performance of Amazon's advertising business and e-commerce operations should not be overlooked. The advertising business provides the company with a relatively high-margin revenue stream, while North American and international retail businesses affect overall sales scale and fulfillment costs. If advertising revenue continues to grow and the e-commerce business demonstrates solid demand ahead of the peak season, it will help improve market sentiment regarding the company's overall profitability.
Source: TradingView
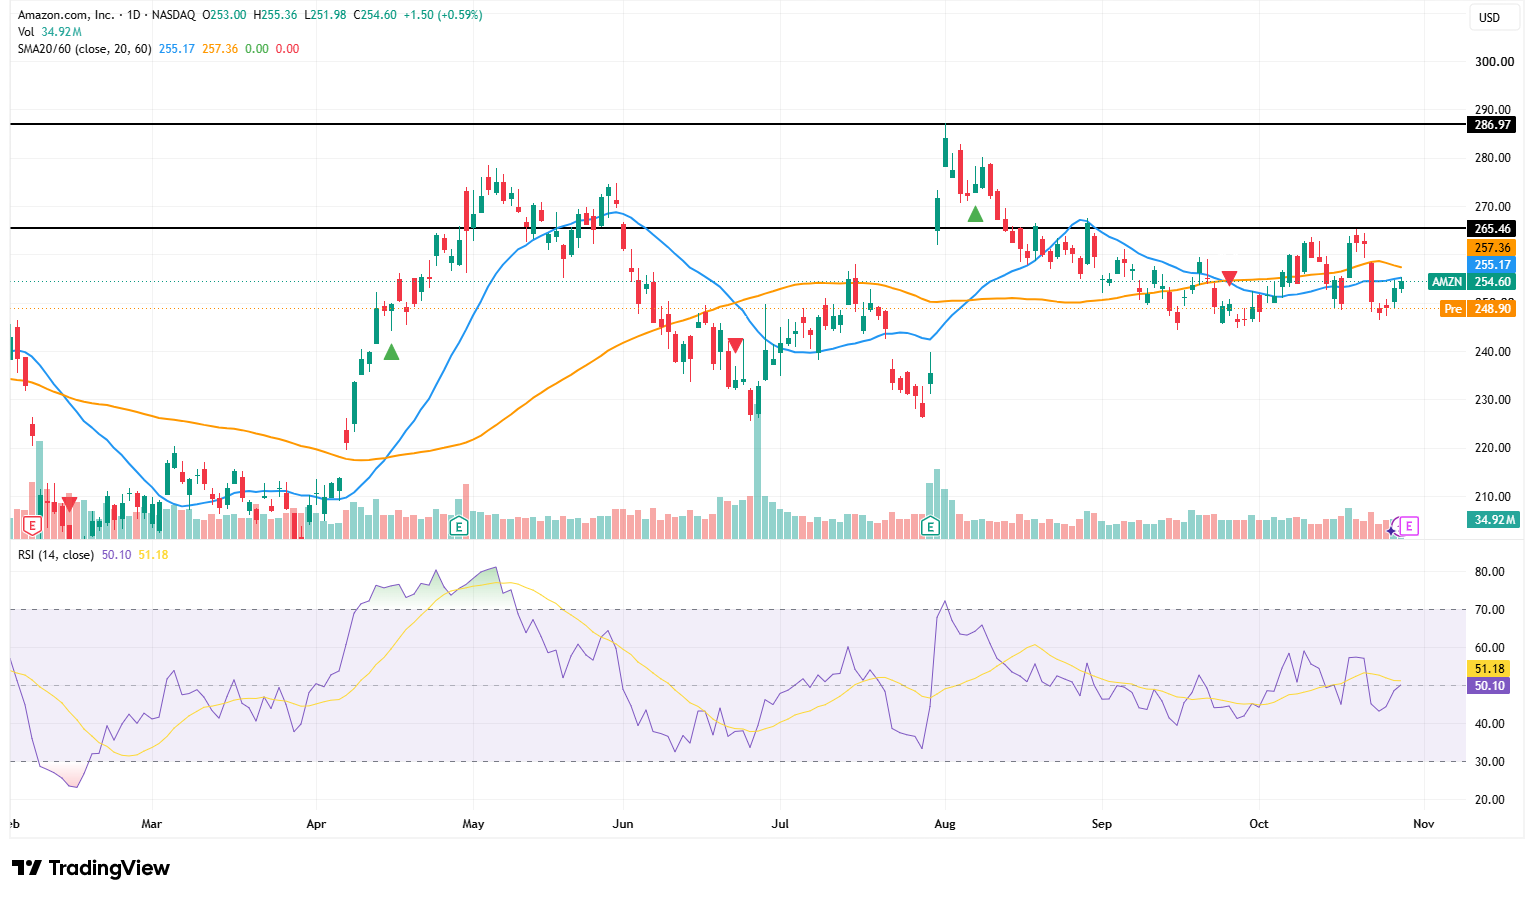
From a technical perspective, Amazon remained range-bound ahead of earnings, recently closing at $254.60 and temporarily holding above the key psychological level of $250. However, pre-market prices pulled back to $248.04, indicating that market sentiment remains cautious prior to the earnings announcement.
Technically, AMZN is currently trading slightly below its 20-day moving average of $255.17 and 60-day moving average of $257.36, with the $255–$258 range forming the first near-term resistance level. The RSI stands at 50.10, near the midpoint and slightly below the signal line of 51.18, reflecting a basic balance between bulls and bears without a clear directional trend yet.
If results and guidance beat expectations and push the stock to hold firmly above $258 on heavy volume, it may subsequently test levels around $265, $270, and $280 in succession, representing an upside potential of approximately 10% from the current price. On the downside, the first level to watch is the $248–$250 support zone. If this area fails to hold post-earnings, the stock could pull back to $240–$245.
This content was translated using AI and reviewed for clarity. It is for informational purposes only.
Recommended Articles











Comments (0)
Click the $ button, enter the symbol, and select to link a stock, ETF, or other ticker.