


Goldman Sachs Stock Price Forecast: Q3 Earnings Push Stock Past $900, Can It Reclaim All-Time High of $1,154 This Year?



AI Podcast


In 2026, Goldman Sachs’ stock experienced three distinct phases: an early decline due to delayed rate cuts and FICC volatility, a mid-year surge to an all-time high of $1,154 driven by recovering M&A and investment banking, and a subsequent pullback to the $880–$900 range from valuation pressures and peer warnings. Strong Q3 earnings propelled a rebound into Q4, supported by robust trading revenue and a reasonable forward P/E of 13 to 14.5. While Wall Street remains broadly bullish with price targets reaching up to $1,245, analysts diverge on whether the stock will revisit historic highs without sustained deal-making momentum.
Goldman Sachs 2026 Stock Price Trend Review
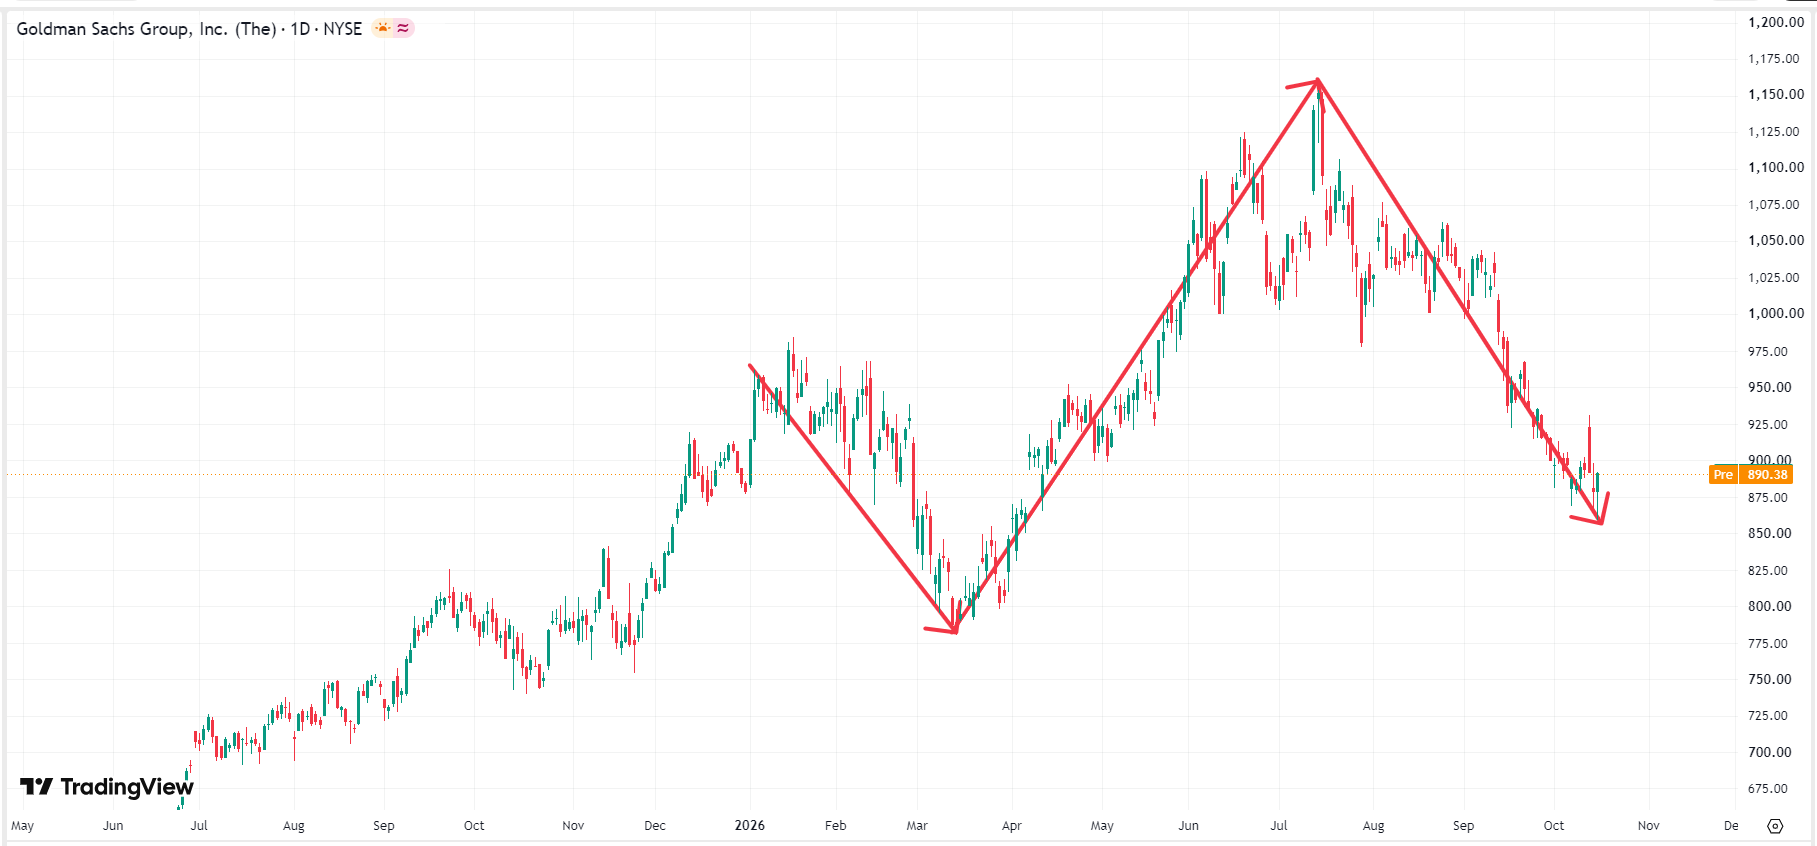
TradingKey - In 2026, the stock price of Wall Street investment banking giant Goldman Sachs Group (GS) mainly went through three stages—a decline, a rally, and another drop—leaving its year-to-date performance virtually flat. From January to March, Goldman Sachs' stock price gradually pulled back from its early-year high of $900, falling to $780 to seek support.
 Goldman Sachs stock chart, Source: TradingView
From April to July, Goldman Sachs kicked off its main rally phase, with its stock price breaking through the major $900 and $1,000 levels in succession and rising to $1,154 on July 15 to hit an all-time high. After breaking above the historic $1,000 peak, Goldman Sachs' stock price failed to immediately hold its ground, subsequently undergoing a significant two-month pullback that tested down into the $880–$900 support zone to shake out positions.
What Are the Reasons for Sharp Fluctuations in Goldman Sachs Stock Price?
At the beginning of the year, stickier-than-expected inflation data led the market to repeatedly delay expectations for the timing of Federal Reserve (Fed) rate cuts, suppressing valuation expansion for major Wall Street investment banks. Furthermore, traditional fixed income, currencies, and commodities (FICC) businesses were disrupted by short-term bond yield volatility early in the year, prompting short-term capital to adopt a wait-and-see approach and weighing on Goldman Sachs' stock price.
After bottoming out in the first quarter, Goldman Sachs released better-than-expected Q1 earnings in mid-April as a catalyst to spark a months-long major rally, driven by a broad recovery in M&A and investment banking. Specifically, the official launch of the global rate-cutting cycle unleashed a surge in demand for corporate restructuring, M&A advisory, and IPO underwriting among multinational corporations and tech giants, fully unlocking the profitability of Goldman Sachs as an industry leader.
In August and September, the decline in Goldman Sachs' stock price was mainly driven by valuation squeezing from high levels and a sector-wide washout triggered by peer warnings. In mid-September, a senior executive at Bank of America publicly issued a cautious warning at an industry conference that third-quarter trading growth could slow, raising market doubts over Q3 results across major Wall Street investment banks; Goldman Sachs' stock dropped sharply by about 4% that day, becoming a heavily hit area of the sector clearing. In addition, sharp volatility in tech stocks prompted quantitative funds and institutional investors to implement overall risk management, shifting from high-valuation blue chips and financial leaders into cash and short-term Treasuries for safety, further exacerbating profit-taking pressure on Goldman Sachs at elevated levels.
Will Goldman Sachs Stock Rise Further in Q4 2026?
The Q3 earnings report released on October 13 strongly drove the stock price to briefly break through the $900 mark, giving Goldman Sachs a powerful bullish carryover effect into Q4. Q4 is traditionally a peak season for final settlement and closing of global corporate bond issuances, capital restructurings, and cross-border mergers and acquisitions. As the world's top investment banking advisor, Goldman Sachs is expected to sustain double-digit annualized explosive growth in fee revenue in Q4.
Influenced by post-U.S. election policy implementation and high-level shakeouts in tech stocks, the U.S. stock market is expected to maintain high volatility and trading volume in Q4. Goldman Sachs' Q3 equity trading revenue surged +72% year-over-year, demonstrating exceptional market-making and profitability capabilities—an edge that is likely to extend into Q4.
Although Goldman Sachs' stock price remains elevated near $900, its forward price-to-earnings (P/E) ratio currently sits around 13 to 14.5 times. Compared to its annualized ROE of as high as 20%+, Wall Street investors generally believe its valuation is not overly inflated, leaving room for upward re-rating.
Can Goldman Sachs Stock Return to All-Time Highs?
Following the release of Goldman Sachs' Q3 earnings report, mainstream Wall Street institutions are generally bullish on its 12-month price target, but there is divergence over whether it will reach a new high. The details are as follows:
Investment Bank | Latest Rating | Price Target |
Barclays | Strong Buy | $1,245.00 |
Citi | Strong Buy | $1,175.00 |
Wells Fargo | Strong Buy | $1,150.00 |
BofA | Buy | $1,050.00 |
HSBC | Hold | $1,007.00 |
UBS | Neutral | $970.00 |
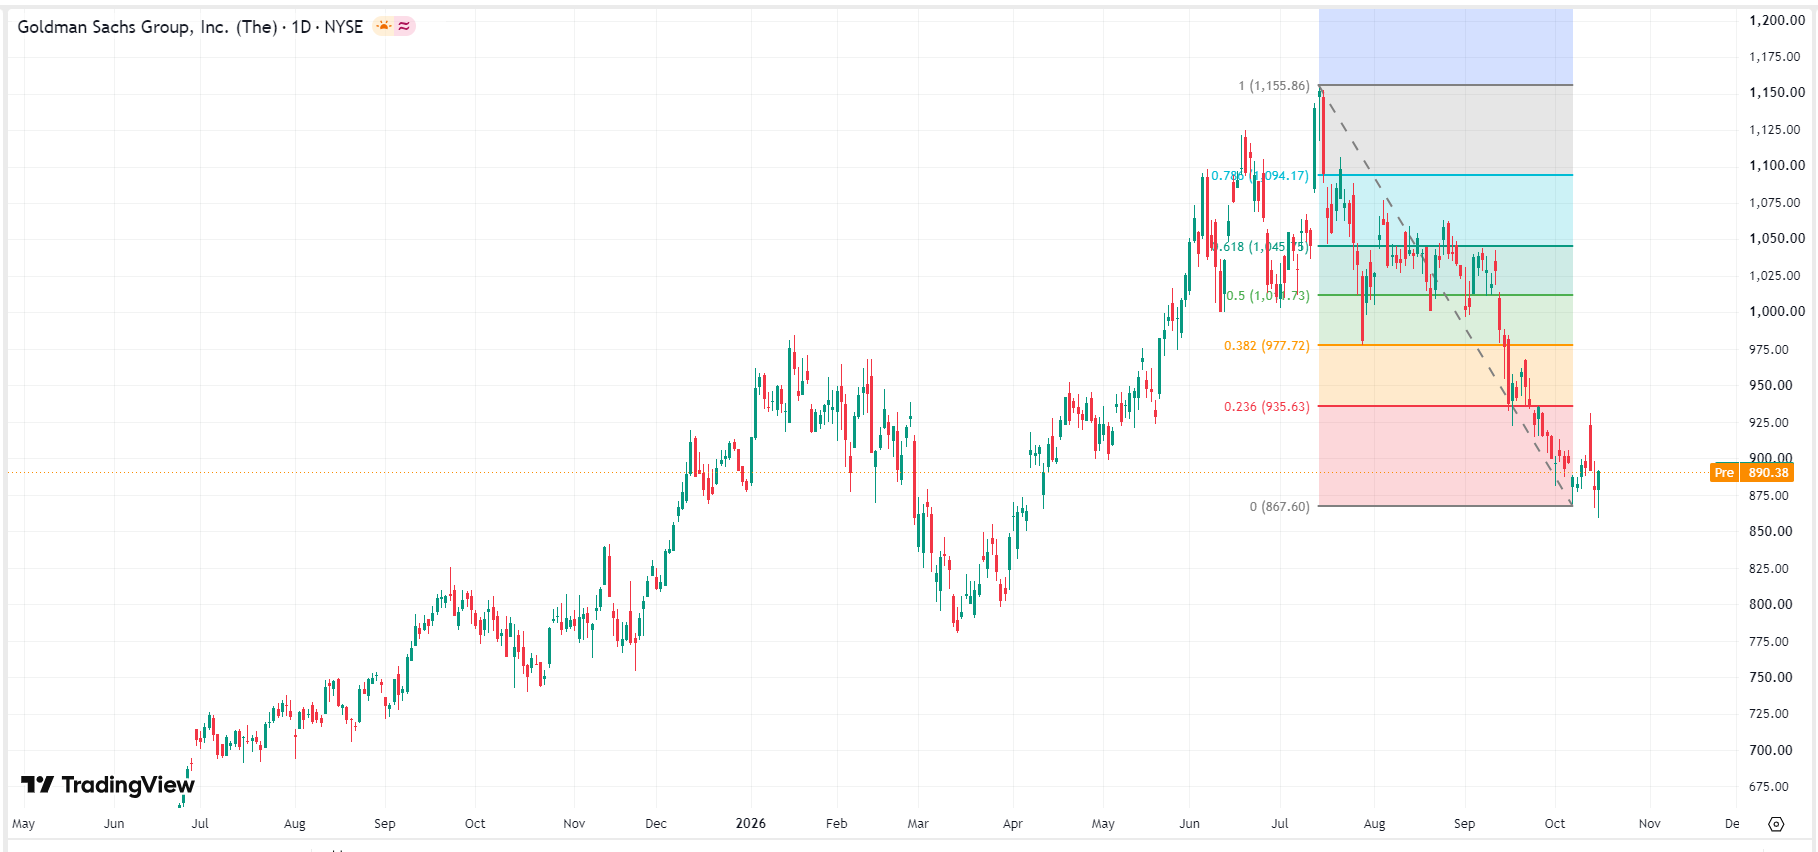
From a technical perspective, the first step for Goldman Sachs' stock price to return to its all-time high requires reclaiming the psychological threshold of $1,000 on heavy volume. This level served as a bottom three times during the pullback from its peak, turning from strong support into strong resistance. Although Q3 earnings boosted a rebound in Goldman Sachs' stock price, directly breaking through this barrier remains difficult unless U.S. M&A and IPO deal volumes continue to explode in the fourth quarter and the first quarter of next year.
 Goldman Sachs stock price chart, Source: TradingView
Conclusion
Goldman Sachs' stock price pulled back to $780 between January and March, weighed down by delayed rate cuts and FICC headwinds; from April to July, driven by a recovery in M&A and investment banking, it surged to an all-time high of $1,154; between August and September, due to squeezing out valuation excess and spillover effects from peer warnings like Bank of America, it retested $880–$900. Currently, investment banks' price targets are generally bullish, but disagreement remains over whether the stock will hit new highs.
This content was translated using AI and reviewed for clarity. It is for informational purposes only.
Recommended Articles







Comments (0)
Click the $ button, enter the symbol, and select to link a stock, ETF, or other ticker.