


ASTS Stock Price Forecast: SpaceX Spectrum Competition Panic Overdone, Deutsche Bank Says Pullback Offers Entry Window



AI Podcast


AST SpaceMobile shares have fallen over 40% year-to-date amid market panic regarding SpaceX acquiring low-band spectrum resources. Despite this sharp volatility, Deutsche Bank upgraded ASTS from Hold to Buy with a $93 price target, arguing the market overreacted to competitive risks. Analysts highlight potential carrier partnerships, notably with T-Mobile, alongside defense sector progress and government funding as strong revenue pillars. Technically, ASTS remains in a weak short-term trend, trading below key moving averages with initial resistance near $52.40, while downside risk persists if support at $36.08 fails to hold.

TradingKey - AST SpaceMobile (ASTS) shares have fallen sharply recently on news of SpaceX acquiring low-band spectrum resources, but Deutsche Bank believes the market has overreacted to changes in the competitive landscape, and the current pullback actually offers investors a more attractive entry window.
Deutsche Bank upgraded its investment rating on AST SpaceMobile from "Hold" to "Buy" and maintained its $93 price target. However, as of October 15, ASTS was still down over 40% year-to-date, down about 67% from its all-time high of $133.86 set in May 2026.
The core reason for this sharp volatility is market concern that SpaceX accelerating the rollout of Starlink Mobile will pose greater competition to AST SpaceMobile's direct-to-cell business.
SpaceX Spectrum Deal Sparks Market Panic
On October 9, ASTS shares plummeted 10%, primarily because SpaceX announced the acquisition of nationwide low-band spectrum resources from Grain Management.
SpaceX disclosed that the transaction involves up to 14 MHz of paired spectrum in the 800 MHz band. Low-band signals possess stronger penetration capabilities and are expected to address the challenge of satellite communications covering indoor and underground scenarios, which the market views as an important step toward filling Starlink Mobile's technical shortcomings.
However, Deutsche Bank analyst Bryan Kraft considered the market's reaction "unwise." In his view, the rapid decline in ASTS's stock price reflects emotional pricing of competitive risks by investors rather than a fundamental deterioration of the company's business model.
This panic also spilled over into the broader telecommunications sector. Shares of AT&T, Verizon, and T-Mobile fell 9.8%, 8.8%, and 13.3%, respectively, with Verizon recording its worst single-day drop since 2002.
T-Mobile Could Become a Key Variable for ASTS
One of the core arguments behind Deutsche Bank's upgrade is a potential reshuffle of carrier partnerships.
Currently, T-Mobile has deployed Starlink technology in its T-Satellite direct-to-cell service. Consequently, SpaceX is both a direct competitor to AST SpaceMobile and a technology supplier for T-Mobile's existing service.
Kraft noted that as SpaceX increasingly becomes a direct competitor to T-Mobile, T-Mobile may transition its direct-to-cell service to AST SpaceMobile out of considerations for supply chain security and competitive balance.
If this thesis plays out, ASTS will complete the final piece of the puzzle among the top three U.S. carriers. Currently, ASTS has already secured partnership agreements with AT&T and Verizon, while T-Mobile could serve as a crucial breakthrough to further expand its U.S. market coverage.
Government Orders Provide Second Pillar of Support for Business
In addition to the potential of carrier partnerships, government business also provides extra support for AST SpaceMobile's commercial prospects.
Citing documents from the U.S. Space Development Agency supporting satellite testing, Deutsche Bank believes AST has made substantial progress in the defense sector. In January this year, AST was selected as a prime contractor for the Missile Defense Agency's SHIELD program. The program falls under the "Golden Dome" missile defense initiative, signaling that AST's technology has obtained a high level of security certification.
Kraft also noted that a Japanese project expected to receive authorization soon could bring up to $1 billion in Japanese government funding support to AST's satellite network. If finalized, the project would become a major component of AST's potential revenue sources.
This implies that AST's commercialization logic does not rely solely on consumer telecommunications. Carrier partnerships, defense projects, and government funding support could together form multiple pillars for the company's future revenue growth.
ASTS Technical Analysis
Looking at the ASTS stock chart, the current price has broken below the 0.786 Fibonacci retracement level ($57) and is approaching its low since September 19, 2025. This currently represents an acceleration of the weekly downtrend following a pullback from high levels, rather than a routine correction, and clear weekly signals of stabilization and reversal have yet to emerge. The current price is close to this week's low of $42.32, with selling pressure remaining dominant.
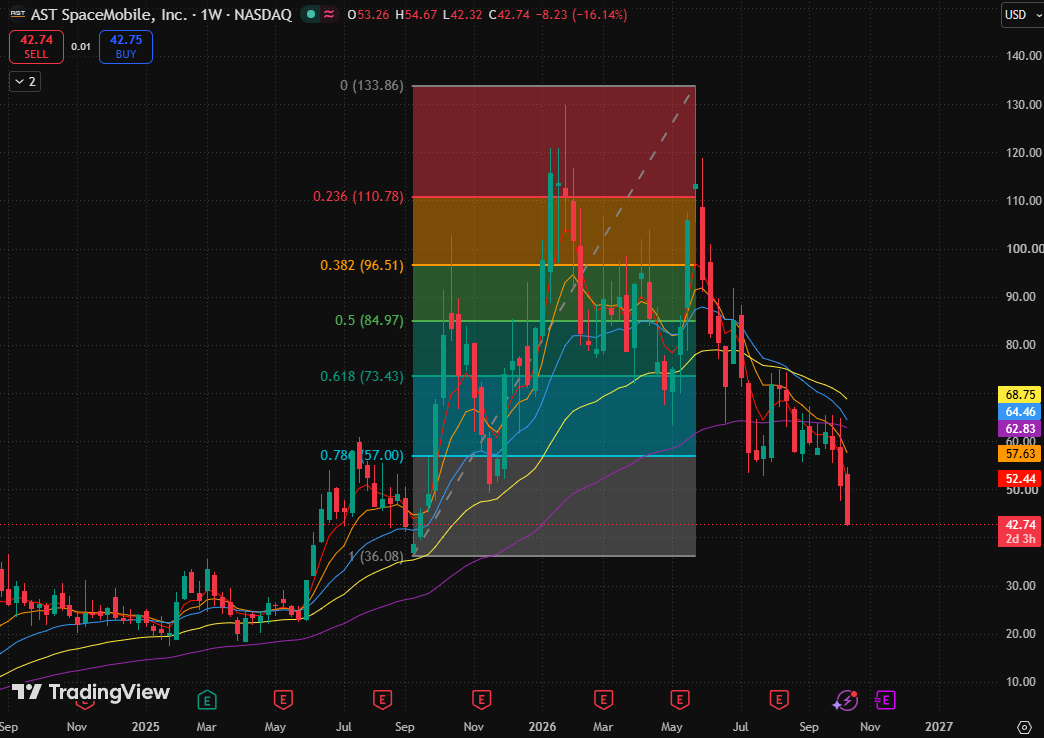
AST SpaceMobile weekly chart, Source: TradingView
Since retreating from its high of $133.86, ASTS has seen its rebound highs move continuously lower. It recently consolidated repeatedly in the $60 to $70 range but failed to reclaim its medium-to-long-term moving averages, subsequently breaking below the key Fibonacci level around $57. The further drop this week indicates that the previous consolidation was more of a bearish continuation than bottom building.
Regarding moving averages, the 5-day, 10-day, 20-day, 80-day, and 160-day moving averages stand at $52.40, $57.61, $64.45, $68.74, and $62.83, respectively. The current price is below all moving averages, indicating a clearly weak short-term trend. However, as the 80-day moving average remains above the 160-day moving average, strictly speaking, all five moving averages have not fully formed a standard bearish alignment, and whether the long-term trend will weaken further remains to be seen.
Regarding upside potential, initial resistance lies near $52.40, corresponding to the 5-day moving average. Above that is the $57.00 to $57.61 region, formed jointly by the 0.786 Fibonacci retracement level and the 10-day moving average; if a rebound fails to reclaim this area, it can still only be viewed as a weak recovery.
On the downside, the primary risk is that $36.08 fails to hold as support, with weekly charts continuing to hit new lows within the measured range, which would further expand the current downward structure.
This content was translated using AI and reviewed for clarity. It is for informational purposes only.
Recommended Articles









Comments (0)
Click the $ button, enter the symbol, and select to link a stock, ETF, or other ticker.