


Tesla Stock Price Forecast: TSLA Faces Resistance at $380, Is the Rally Over or Gathering Momentum?



AI Podcast


On October 8, Eastern Time, Tesla shares faced downward pressure in pre-market trading, continuing to struggle at the key $380 resistance level. Despite being driven by vehicle delivery recoveries and FSD advancements, the stock's forward P/E ratio exceeds 80x, while massive AI and robotics capital expenditures weigh on short-term free cash flow. Furthermore, technical overhead resistance, profit-taking, and a potential slower Federal Reserve rate-cut path create formidable supply pressure. Without fresh fundamental catalysts, the current rebound risks ending, potentially leading the stock to retest previous lows near the $300 level.

TradingKey - Tesla Struggles Repeatedly at $380 Resistance: Bullish Continuation or Pullback Ahead?
On October 8, Eastern Time, Tesla (TSLA) shares continued to face downward pressure, falling over 1% in pre-market trading today to temporarily trade at $373.7. Since late July, after staging a strong rally from around the $300 low, Tesla's stock price met significant resistance and experienced high-level consolidation during three attempts to test the key resistance area of $380. So why is Tesla's stock price blocked at this level, and can it rebound further to break through?
Tesla's current rally has been primarily driven by a recovery in vehicle deliveries, advancements in Full Self-Driving (FSD), and expectations for the commercial rollout of the Robotaxi. However, as the stock price surged from this year's low of $297 to $370–$380, its forward price-to-earnings (P/E) ratio has climbed back to an extremely elevated level of over 80x. Meanwhile, the lack of short-term financial data exceeding expectations to continuously inject fresh momentum has cooled long-term institutional capital's appetite to chase prices higher in this region.
In addition, the market is closely watching the massive capital expenditures associated with the Dojo supercomputer, the Dojo 2 chip, the establishment of mass production lines for the humanoid robot (Optimus), and AI computing infrastructure, which continue to weigh on the speed of free cash flow (FCF) turning positive in the short term.
Of course, while Tesla rebounded, it also encountered technical overhead resistance from trapped positions at previous highs and profit-taking pressure. A large volume of shares bought at historical highs remains trapped in the $380–$400 range. Meanwhile, short-term profit-taking capital—up more than 20% from the low—has chosen to lock in gains ahead of the $380 psychological milestone, forming a formidable wall of supply pressure.
In the short term, a slower rate-cut path by the Federal Reserve or prolonged high interest rates will suppress loan demand for high-ticket consumer goods, directly impacting buyers' willingness to purchase vehicles. Under these unfavorable circumstances, technical analysis shows that the vicinity of $380 is not only a dense trapped-position area from previous swing highs, but also a core outpost for bulls and bears before battling over the $400 psychological mark, potentially enticing bears to exert force.
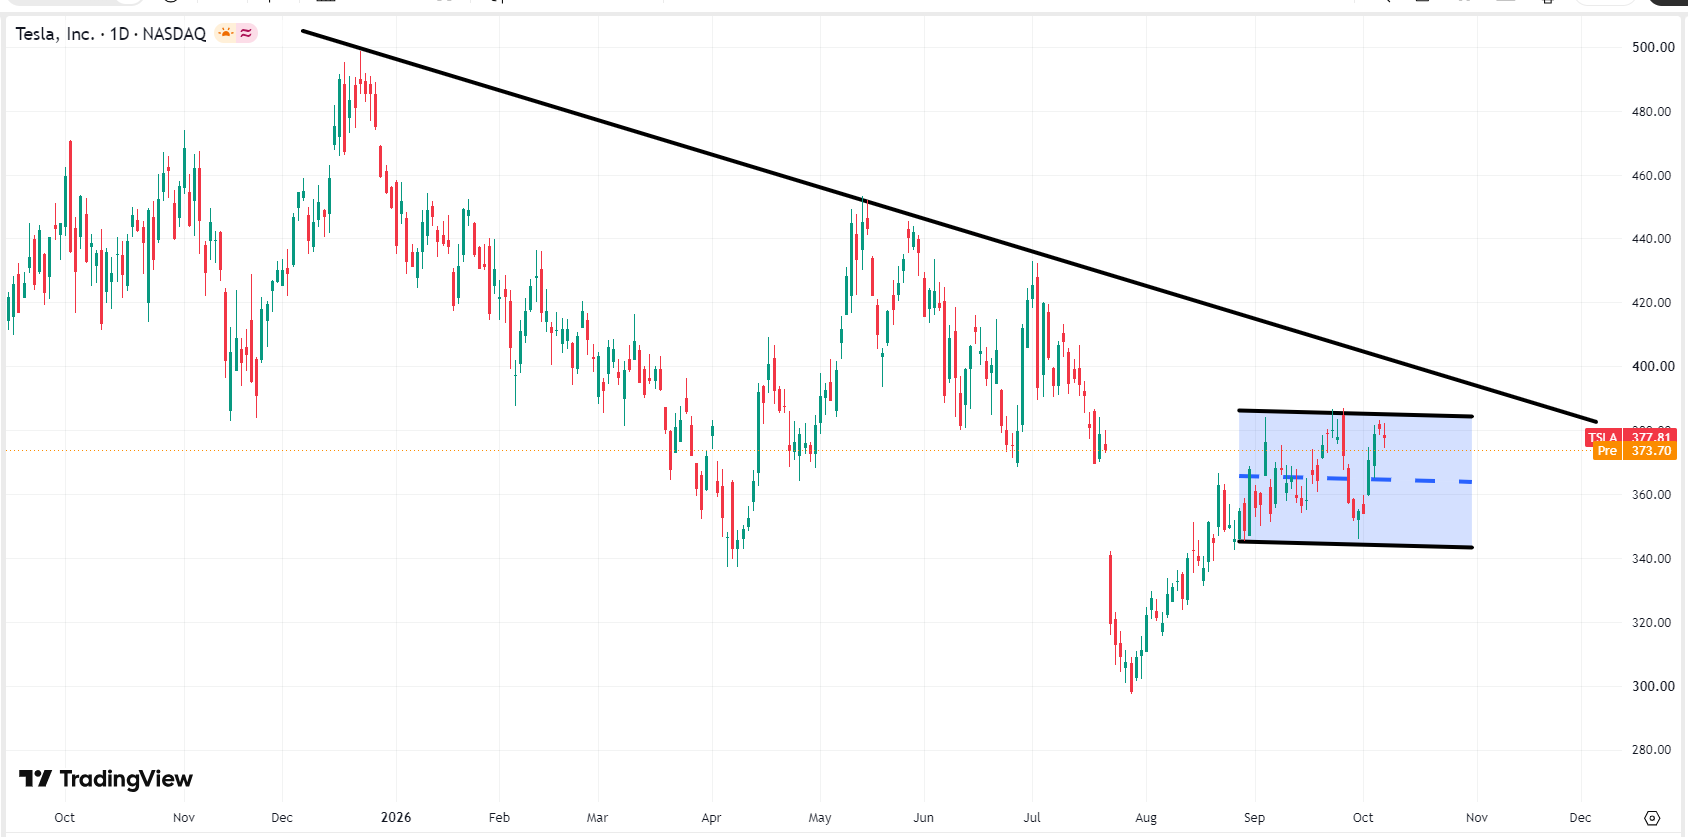 Tesla stock chart, Source: TradingView
Over the medium to long term, Tesla's stock price also remains in a downward trend. Looking ahead, if Tesla's fundamentals lack fresh positive catalysts—such as clearing FSD commercial licensing hurdles, scaling Optimus factory production, or Fed rate cuts—it will be difficult for the stock price to build momentum and rally again. It is more likely that the rebound will end, turning to retest the previous low at the $300 level.
This content was translated using AI and reviewed for clarity. It is for informational purposes only.
Recommended Articles










Comments (0)
Click the $ button, enter the symbol, and select to link a stock, ETF, or other ticker.