


AMD Stock Forecast: Citi Raises Target to $800 as CPU Market Expansion Expectations May Support Continued Stock Gains



AI Podcast


As of the close on Wednesday, October 7, Eastern Time, AMD experienced a slight pullback of 0.55% following a record high, yet technical indicators confirm a sustained bullish trend above key moving averages. Citi recently raised AMD's price target to $800 from $575, maintaining a "Buy" rating, driven by projections that the CPU addressable market could reach $300 billion by 2030 due to expanding AI agent demand. While supply constraints persist, AMD is actively expanding advanced capacity with TSMC. Investors should monitor server CPU shipments, data center revenue, and potential valuation risks if market growth misses projections.

TradingKey - As of the close on Wednesday, October 7, Eastern Time, AMD (AMD) fell 0.55% on Wednesday after hitting a record high of $658.52 on Tuesday. However, technical indicators show the stock remains in an uptrend, while Citi recently raised its price target sharply from $575 to $800, further heightening market focus on the long-term growth potential of the company's CPU business.
Citi Raises Price Target to $800: CPU Market May Grow to $300 Billion by 2030
According to the latest reports, Citi analyst Atif Malik raised AMD's price target from $575 to $800 while maintaining a "Buy" rating. Citi also raised its projection for the CPU addressable market in 2030 to $300 billion, a significant expansion from approximately $25 billion in 2025, expecting the CPU market to grow at an average annual rate of about 60% over the next few years.
The main reason for Citi's price target hike on AMD is related to the growing adoption of AI agents. Taking Meta's (META) Muse as an example, personal AI agents need to run continuously. Compared with traditional on-demand chatbots, personal AI agents utilize inference computing, memory, and network resources for longer periods, which may increase server CPU demand. Citi believes AMD could be one of the primary beneficiaries of this CPU demand expansion, and Meta itself is a major customer of AMD.
Notably, CEO Lisa Su recently stated that the company plans to significantly increase chip supply in 2027, as AI-related demand currently remains higher than available supply. AMD is discussing with suppliers such as TSMC to expand advanced wafer capacity required for CPUs and GPUs, while extending its capacity planning horizon to the next three to five years.
From a stock price perspective, the $800 target price is about 24% higher than AMD's latest closing price of $645.86. However, this target is based on the assumption that AI agents will drive a rapid long-term expansion in CPU demand. Therefore, it remains necessary to monitor server CPU shipments, data center revenue, market share, and whether new capacity can keep pace with demand growth. If the actual growth rate of the CPU market is lower than Citi's expectations, it could also impact corresponding earnings and valuation expectations.
AMD Stock Price Technical Analysis
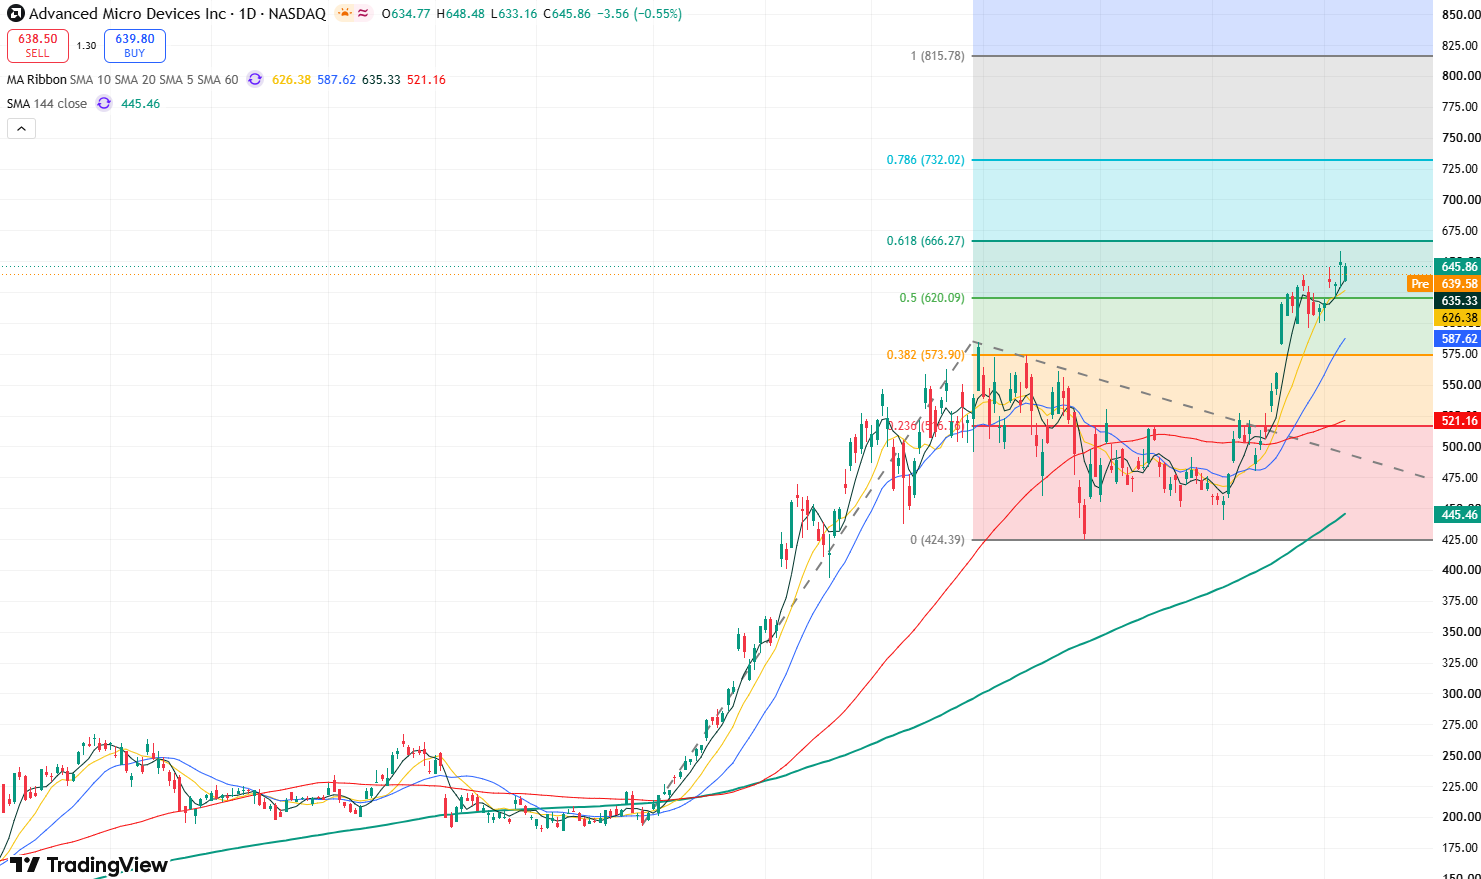
AMD stock price daily chart, Source: TradingView
Looking at the daily chart of AMD's stock price, the recent candlestick pattern shows a clear bullish trend. As the candlesticks continue to trade above the 5-day and 10-day moving averages, it signals strong market bullish momentum, indicating that the stock price still has upside potential in the short term.
Currently, after reaching an all-time high of $658.52 on Tuesday, the stock price pulled back by 0.55% yesterday; however, it remains firmly above the 5-day moving average, suggesting that the likelihood of a short-term rise is greater than a pullback.
On the upside, the primary resistance level to watch is the Fibonacci 0.618 extension level at $666. If the stock can break through strongly and hold above this level, it will open up upside space toward $732, with further potential to test the $800 mark.
On the downside, the primary support level to monitor is the 5-day moving average ($635), followed by the 10-day moving average ($626). If the stock price falls below the 10-day moving average support, it may further test the support of the 20-day moving average.
This content was translated using AI and reviewed for clarity. It is for informational purposes only.
Recommended Articles










Comments (0)
Click the $ button, enter the symbol, and select to link a stock, ETF, or other ticker.