


As 2026 US Midterm Elections Near, Will the S&P 500 Index Rally After Election Day?



AI Podcast


Historical data shows that U.S. midterm election years are typically the weakest and most volatile period within the presidential cycle, characterized by summer declines and heightened policy uncertainty. However, this volatility is generally short-lived. Once election outcomes are settled and political gridlock is established, the S&P 500 historically stages a reliable and strong recovery, posting post-election gains. While these historical patterns provide a useful framework for the 2026 midterms, ultimate market performance will depend on macroeconomic fundamentals, including inflation, interest rates, economic growth, and corporate earnings.

TradingKey - The 2026 U.S. midterm elections will be held on November 3 Eastern Time. The key question for investors is how this political maneuvering will impact the S&P 500 Index?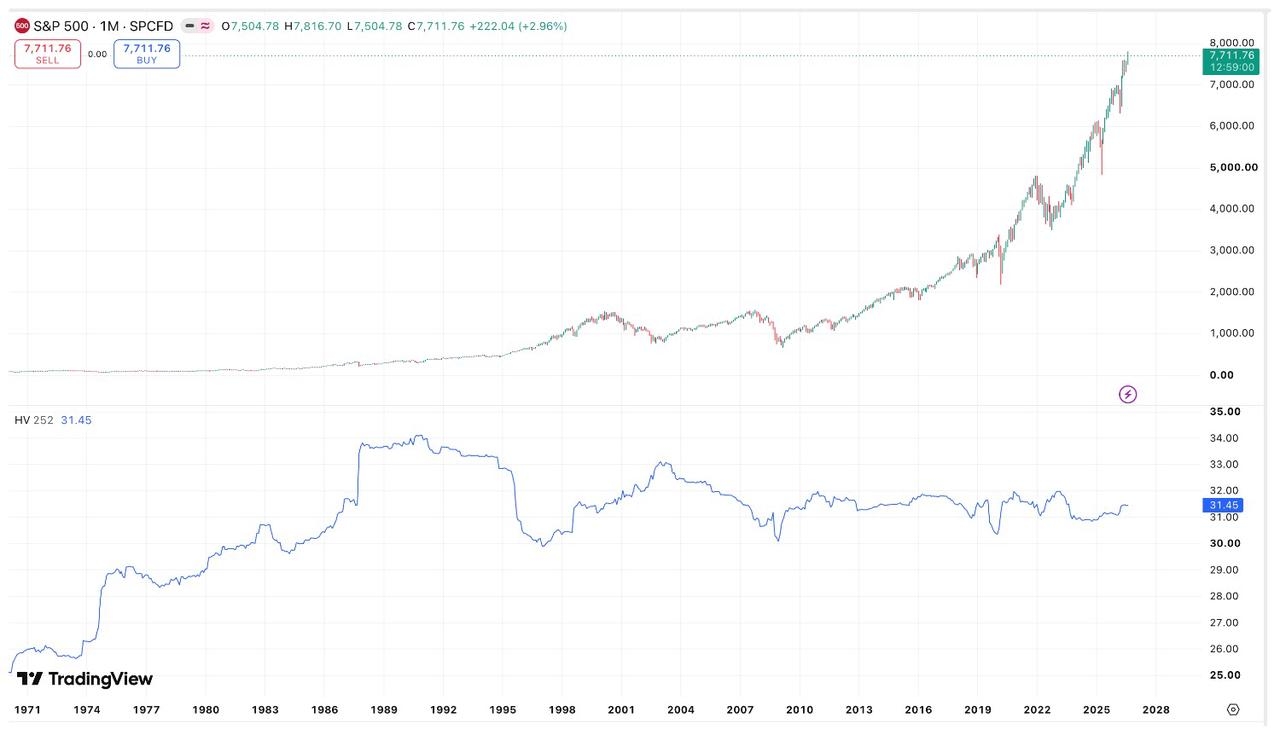
[S&P 500 Index performance and its annualized volatility (H252), Source: TradingView]
Midterm Election Years Are Typically the Weakest of the Four-Year Cycle
Historical data reveals a clear pattern: midterm election years are typically the weakest period for the stock market within the four-year presidential cycle, but a strong rally often follows once the elections conclude.
Research from Nasdaq's Dorsey Wright shows that across the 24 midterm election years since 1928, the S&P 500's average return was just 3.68%, less than a third of the 13.96% average return in the third year of the cycle (the post-election year), which is historically the strongest.
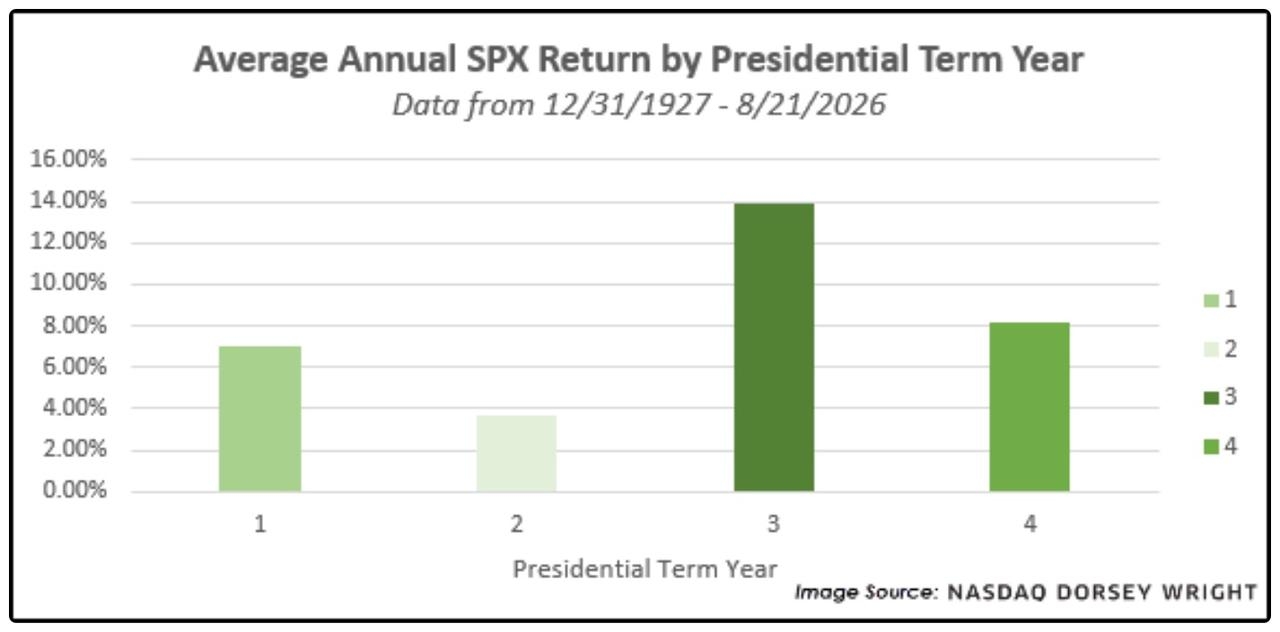
[Source: Dorsey Wright]
Data from LPL Financial also confirms this pattern, showing an average gain of just 4.6% in midterm election years alongside the highest volatility, with maximum drawdowns typically occurring during this phase as well.
Even more notably, declines in midterm election years can be severe: the S&P 500 fell 29.7% in 1974, 23.4% in 2002, 28.5% in 1930, and 19.4% in 2022. Since 1960, the average maximum drawdown in midterm election years has been 19.4%, compared to just 12.5% in other years.
Summer Performance: Notably Weaker in Midterm Election Years
An analysis by Dow Jones Market Data from 1928 to 2025 shows that from late April to late September in midterm election years, the S&P 500 declines by an average of about 2.8%. This is the worst-performing window in the four-year cycle.
Year Type | Average Performance from Late April to Late September |
Midterm Election Year | -2.80% |
Presidential Election Year | 0.0505 |
Post-Election Year | 0.0364 |
Pre-Election Year | 0.0224 |
This average was significantly impacted by several extreme years, with a drop of over 25% in 1930, a 29.7% decline in 1974, and a 23.4% fall in 2002. Even after excluding these extreme values, the average return for the same period across all remaining midterm election years was indeed only +0.006%, which is virtually negligible.
Post-Election Rally: Pattern Is Most Reliable
After election results are settled, the market typically experiences a strong recovery.
Time Horizon | Average Gain | Probability of Gain | Data Period |
3 Months Post-Election | 0.065 | Vast majority positive | Since 1970 |
12 Months Post-Election | 0.182 | 100% (17 out of 17 gains) | Since 1954 |
12 Months Post-Election (Capital Group Data) | 0.154 | — | Since 1950 |
According to data from LPL Financial, in the 17 midterm elections since 1954, the S&P 500 posted gains in the 12 months following every single election, with an average gain of 18.2%.
Capital Group's analysis also confirms this pattern: since 1950, the average return in the year after a midterm election has been 15.4%, roughly double that of other periods.
Notably, Capital Group included the 1950 midterm election, which dragged down the overall average; even so, the return remained significantly higher than the average for non-election years.
From a quarterly cycle perspective, the fourth quarter of a midterm election year marks a clear turning point. Research from Nasdaq Dorsey Wright shows that since 1930, the probability of positive returns for the S&P 500 in the fourth quarter of a midterm election year is as high as 83.33%, far higher than 44% in the first quarter and 52% in the second quarter.
2018 and 2022: Two Typical Samples
The past two midterm elections displayed completely different market reaction patterns.
On November 6, 2018, the day of the U.S. midterm elections, the S&P 500 rose about 0.63%. After the election results became clear, the S&P 500 surged a further 2.12% on November 7.
At the time, Democrats regained the House of Representatives while Republicans retained control of the Senate, and the market quickly digested the outcome of a divided Congress. After the election results were announced, the market staged a clear short-term rally.
The year 2022 was another typical scenario.
On midterm election day, November 8, market reaction was relatively muted, with the S&P 500 Index rising slightly by about 0.96%. However, on the day after the election, tight vote counts in key states (such as Georgia) left control of Congress in limbo. This uncertainty, coupled with other negative factors, caused the market to fall sharply, with the S&P 500 dropping 2.08%, marking its worst post-election-day performance since 2012.
Notably, the S&P 500 Index had already fallen about 19.7% year-to-date at the time, with the market continuously suppressed throughout the year by factors such as high inflation, rapid Federal Reserve rate hikes, and economic growth concerns.
What both elections had in common was that both were expected to yield a divided Congress, and historical data shows that periods of "divided government" (where the White House and Congress belong to different parties) are relatively favorable for the stock market. Investors believe political gridlock helps prevent major tax increases or radical legislation, thereby supporting the market.
Pre-Election Volatility Intensifies as Fading Uncertainty Fuels Post-Election Rally
In the months leading up to midterm elections, policy uncertainty climbs and stock market volatility tends to head higher.
Data from Capital Group, measured by the standard deviation of daily returns, shows that since 1970, median return volatility in midterm election years has been nearly 16%, compared to about 13% in other years.
However, once the election results are settled, the market usually stages a strong recovery. The logic behind this rally is that investors hate uncertainty, and the end of the election brings greater clarity to the policy outlook.
Data shows that since 1970, the S&P 500 has gained an average of 6.5% in the three months following an election, well above the 2.5% average in the three months prior, with little difference in the size of the rally regardless of which party wins.
In addition, analysis from Capital Group notes that since 1969, during periods of divided government, the S&P 500 has averaged an annual gain of about 9%, well above the roughly 5% gain during periods of single-party control. This also explains why investors favor post-midterm 'political gridlock,' as a system of checks and balances reduces the risk of sharp policy shifts.
Summary
For investors looking ahead to 2026, historical patterns offer an important reference point: the uncertainty brought by midterm elections is typically short-lived, and market performance historically improves significantly once election results are settled. However, whether 2026 will repeat this pattern ultimately depends on fundamental factors such as economic growth, inflation, interest rates, corporate earnings, tariffs, energy prices, and geopolitics.
This content was translated using AI and reviewed for clarity. It is for informational purposes only.
Recommended Articles











Comments (0)
Click the $ button, enter the symbol, and select to link a stock, ETF, or other ticker.