


Texas Instruments Stock Forecast: Can Industrial Demand Sustain TXN’s Recovery?



AI Podcast


Texas Instruments posted strong second-quarter results driven by broad-based demand, particularly in industrial, automotive, and data center markets, prompting a 7% dividend hike. The pending Silicon Labs acquisition aims to expand wireless capabilities, though funding may constrain cash flows. Elevated valuations raise execution risks, but robust factory utilization and CHIPS Act proceeds support cash flow coverage. Technically, the stock maintains bullish momentum, supported by moving averages and an RSI of 69. Immediate resistance stands at $278.72, while key support holds at $273.70, dictating short-term price direction.

TradingKey - Texas Instruments (TXN) closed last week at $278.07, an increase of $11.43 from the prior Friday, or about 4.29% for the week. Friday itself gained $7.42, or 2.74%, from Thursday’s close. The latest earnings call was on July 22, when CEO Haviv Ilan said demand was broad-based across industrial, data center and automotive markets; last week’s move should not be attributed to a new earnings call. Ilan was very optimistic about the semiconductor market recovery, and Texas Instruments may be justifying its above-market valuation with its strong quarterly results.
TI Raises Its Dividend for the 23rd Consecutive Year
Texas Instruments raised its quarterly dividend by 7% to $1.52 per share on September 17, making the annual dividend $6.08. The dividend is scheduled to be paid to shareholders on November 10. The record date was set for October 30. The payment remains subject to formal board declaration at its regular October meeting. Texas Instruments has increased its dividend each year for the last 23 years, and the increase reflects the company's confidence in the health of the business. As a result of the dividend increase, the cash payout to shareholders will increase, and Texas Instruments may face constraint on its cash flows, especially if the company makes an acquisition and repurchase offers remain in effect. However, with the strong results from the second quarter and Q3 guidance, Texas Instruments may continue its M&A activities.
Q2 Showed a Broad-Based Demand Recovery
Revenues for the quarter were $5.46B, up 23% from the year ago quarter and 13% from the previous quarter. Operating profit and net income for the quarter increased 48% and 53% respectively. EPS for the quarter was $2.14, which included a 5 cent benefit. Management noted in the earnings call that they experienced broad-based demand and industrial revenues increased 30% and automotive revenues increased in the mid-teens from the year ago quarter. Management noted that data center revenues more than doubled from the year ago quarter and increased 20% from the prior quarter. Management attributed the overall results to both the cyclical industrial market recovery and demand for artificial intelligence.
Analog and Embedded Both Improved
Revenue from TI’s largest product category, analog, grew 26% to $4.37 billion. Embedded processing revenues increased by 16% to $788 million. With a better product mix, TI improved gross margin from 57.9% to 61.4%. Improvement in gross margin shows the benefit of operating at higher factory utilization, and indicates TI’s manufacturing model. When factory utilization increases, TI benefits from fixed costs of manufacture being spread over a greater number of chips, which increases the margin. When factory utilization decreases, it has the opposite impact on margins. If demand from the automotive and industrial market goes down, there could be a decrease in factory utilization, and despite an increase in revenues from the previous year, it could result in a decrease in operating profits.
Q3 Guidance Requires Another Step Higher
For the current quarter, expected revenues of $5.65 to $6.15 billion, and expected earnings of $2.23 to $2.57, indicate expected revenues of approximately $5.90 billion. The guidance implies that management expects the recovery to continue rather than simply stabilize.
For me, signalous that Q3 results would be positive include: (i) reported revenue in the upper half of management’s guidance range, (ii) positive gross margin trends, and (iii) continuing strength in industrial and automotive demand and order commentary.
A small earnings miss would be less important than a negative read on the company’s industrial and/or automotive end markets, which are the company’s largest and most strategic end markets.
Cash Flow Is Improving, but the Definition Matters
For the 12 months ended June 2026, the company reported cash flow from operations of $8.67 billion and capital expenditures of $3.31 billion. TI reported free cash flow of $6.53 billion under its non-GAAP definition, which adds approximately $1.18 billion of U.S. CHIPS Act incentive proceeds to operating cash flow less capital expenditures.
The $1.18 billion of CHIPS Act proceeds is added in TI’s free-cash-flow reconciliation; it is not part of the $8.67 billion GAAP cash flow from operations.
In the absence of the proceeds from the CHIPS Act, cash flow from operations was $8.67 billion and free cash flow was approximately $5.36 billion.
Using the simpler $5.36 billion free-cash-flow figure, the new $6.08 annual dividend implies roughly $5.55 billion of annual cash dividends at the current share count, so coverage is slightly below 1x on that definition. TI does not state an 80% dividend payout policy; its long-term objective is to return all free cash flow to shareholders over time through dividends and repurchases. TI’s reported $6.53 billion free cash flow, which includes CHIPS Act proceeds, does cover the current annualized dividend run rate.
The Dividend Still Has Strong Cash Support
Tex. Instruments (TI) paid dividends of about $5.11 billion and repurchased about $707 million of stock in the last 12 months. Those cash returns totaled about $5.82 billion, compared with TI’s reported $6.53 billion of trailing free cash flow; coverage is tighter using the simpler $5.36 billion free-cash-flow calculation that excludes CHIPS Act proceeds.
The new quarterly dividend of $1.52 will be paid out the first time starting in November, with the first scheduled payment on November 10, 2026, subject to formal board declaration. The company aims to return all of its free cash flow to shareholders and has in the past, making it an attractive stock for those seeking income.
Focusing on free cash flow provides more transparency on whether the company can support its earnings and dividends.
Silicon Labs Adds a Strategic Growth Option
The acquisition of Silicon Labs strengthens TI's embedded and analog products with wireless connectivity. TI aims to achieve run-rate cost synergies of about $450 million within three years after the closing of the acquisition.
The acquisition is still pending approval from regulatory agencies but Silicon Labs shareholders approved the merger on April 30, 2026. It is TI's intention to fund the acquisition with a combination of cash on hand and debt financing.
From a strategic perspective, the acquisition enhances TI’s ability to provide customers with more embedded systems. It also provides the potential for TI to improve its revenue growth and cross-sell other products.
Valuation Raises the Execution Bar
Texas Instruments currently trades at roughly 42x trailing earnings at its $278.07 share price. Even with the semiconductor industry still in a cyclical downturn, an elevated valuation is expected. The technical analysis suggests continued bullish momentum and buy-side pressure.
Long-term cycle shifts, continued growth in data center semiconductor demands, and increasing world-wide factory and manufacturing growth could be catalysts for Texas Instruments' shares.
Negative revisions for 2026 estimates, a downtrend in industrial demand, and/or margin compressions could precipitate a selling event. With shares trading at their current levels, any of the above could cause a significant selloff.
Texas Instruments Technical Analysis: TXN Breaks $275.21 as Bulls Target $281.75
Tech analysis suggests continued upward momentum. The bullish breakout from the $273.70 - $275.21 level is further validated by a series of higher lows and a rising trendline. The share price is also supported by both the 50- and 200-period moving averages. Relative Strength Index (RSI) is also bullish at 69, above its signal line near 62.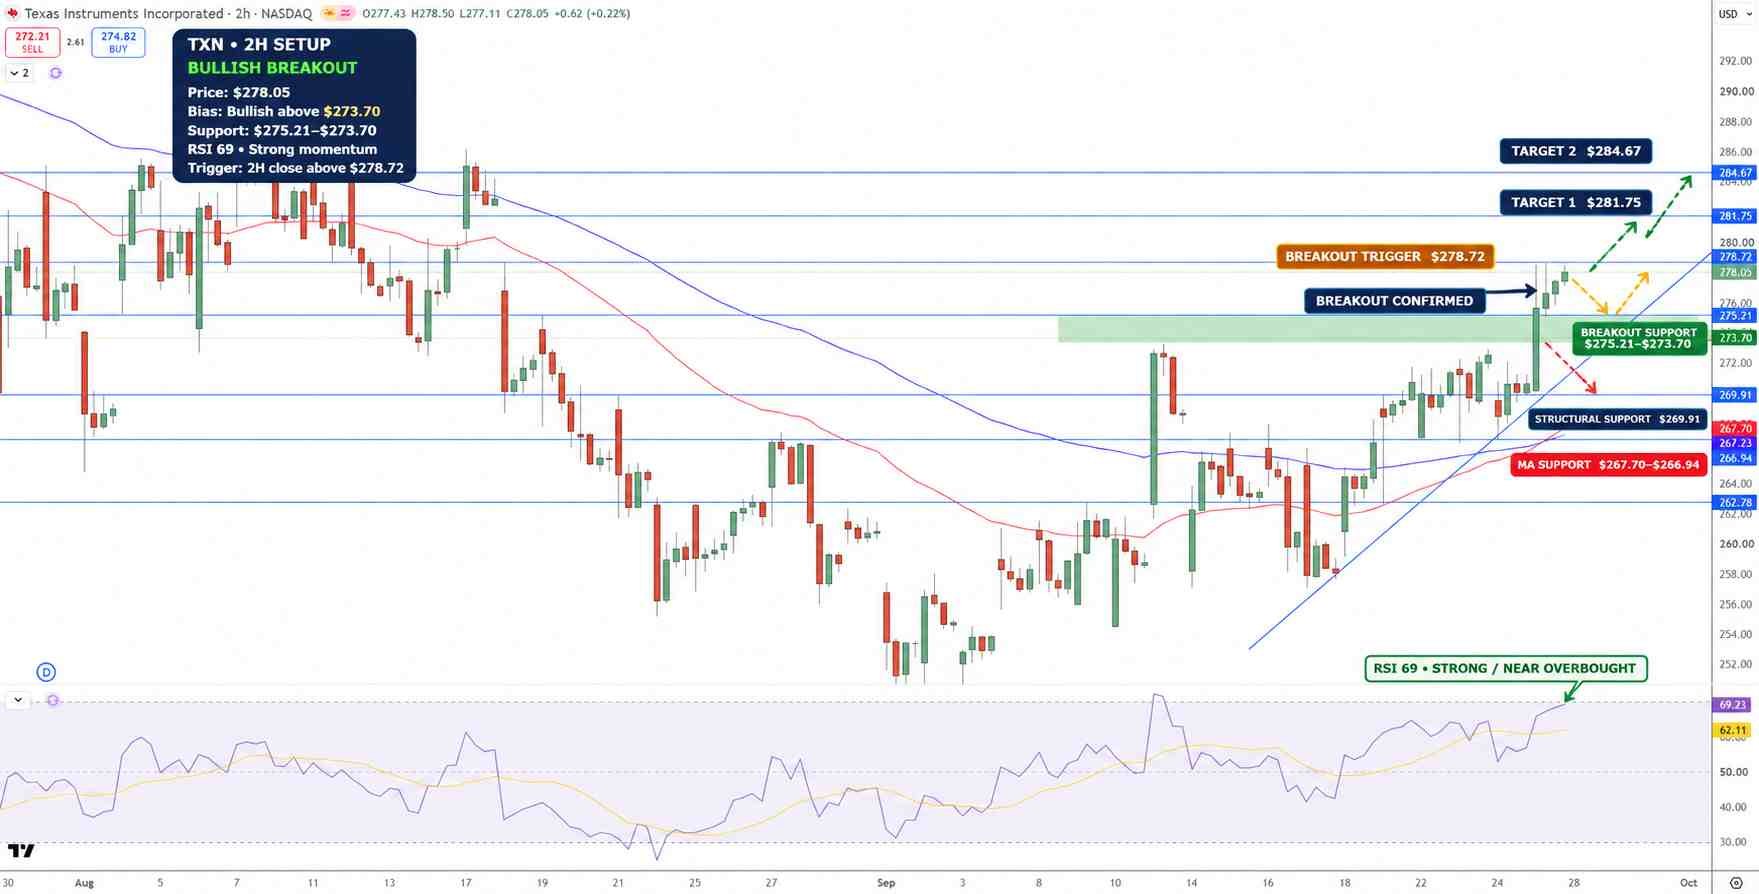
Texas Instruments Stock Price Chart - Source: Tradingview
While a further leg higher is possible in the short-term, a period of sideways action may be more prudent to alleviate the compressiveness of the current uptrend.
Immediate resistance is at $278.72. A 2 hour close above that would bring the next resistance at $281.75 and the final resistance at $284.67.
The first support level is at $275.21 and is followed by $273.70 and then $269.91. Further support is found at the moving average at $267.70 and $266.94. As long as $273.70 holds, the outlook for TXN is bullish with $278.72 being the level to break for confirmation.
Key Levels
• Closing price: $278.07
• Big support: $275.21 to $273.70, then $269.91, then $267.70 to $266.94
• Big resistance: $278.72, then $281.75, then $284.67
• Relative Strength Index (RSI): 69
• Breakout level: $278.72 for a close above for a target of $281.75
Why is Texas Instruments stock in focus now?
TXN’s shares are trading higher this week after continued optimism around the Q2 recovery and the company’s recent dividend increase. Additionally, the company’s Q3 guidance indicates further revenue growth.
What level confirms a stronger TXN breakout?
In this context, a move above $278.72 would suggest further upside and justify an upside target at $281.75, and potentially $284.67. A move below $273.70 would be bearish.
Bottom Line
TXN is trading at a trailing P/E ratio of roughly 42 and a forward P/E of roughly 29. Therefore, the stock is positioned for more upside if the company reports strong results and cash flow while integrating its recent acquisition of Silicon Labs. Management has stated it will continue to return cash to shareholders.
From a technical perspective, the stock is still bullish as long as it trades above $273.70. A move above $278.72 would give the stock further upside toward $281.75, while a move below $273.70 would give bearish signals.
Recommended Articles











Comments (0)
Click the $ button, enter the symbol, and select to link a stock, ETF, or other ticker.