


SanDisk Stock Price Forecast: AI Storage Demand Drives NAND Prices Higher, Can the Stock Break $2,000?



AI Podcast


Driven by surging AI infrastructure demand and tightening NAND supply, SanDisk reported stellar fourth-quarter fiscal results, with revenue up 372% year-over-year and gross margins expanding to 84.6%, largely propelled by price hikes. While robust pricing power and long-term supply agreements support near-term momentum, profitability remains highly sensitive to NAND market fluctuations and sluggish consumer electronics demand. Technically, the stock exhibits bullish momentum, targeting a key resistance zone of $2,000–$2,060, while recent S&P 100 inclusion enhances institutional visibility.

TradingKey - Against the backdrop of continued expansion in AI infrastructure investment and tightening NAND flash supply, SanDisk (SNDK) has once again become the focus of the U.S. memory sector. Boosted by an analyst initiation and expectations of industry price hikes, SanDisk shares rose 6.82% on Tuesday to close at $1,887.04, reaching an intraday high of $1,909.48.
As a result, the market is eager to see whether AI data centers can drive the NAND industry into a more durable growth cycle and whether SanDisk's stock price can effectively break through $2,000.
AI and NAND Price Hikes Remain Core Drivers of SanDisk's Rally
SanDisk primarily provides NAND flash memory and related storage products, with applications spanning AI data centers, personal computers, smartphones, and consumer-grade storage devices. Unlike Micron, which produces DRAM and HBM, SanDisk's main point of benefit in this AI rally stems from high-capacity flash memory demand driven by model training data, inference content, and long-term data archiving.
For the fourth fiscal quarter ended July 3, 2026, SanDisk's revenue reached $8.965 billion, up 372% year-over-year and 51% quarter-over-quarter; the company stated that approximately two-thirds of the sequential increase came from product price hikes, while one-third came from higher shipment volumes. Full-year revenue reached $20.248 billion, up 175% year-over-year, with data center business revenue surging 437% to $5.153 billion.
Price increases also significantly improved profitability. SanDisk's fourth-quarter non-GAAP gross margin rose to 84.6% from 78.4% in the previous quarter, with adjusted EPS reaching $39.25. The company expects first-quarter revenue for fiscal 2027 to be between $10.3 billion and $10.8 billion, with the midpoint representing a sequential increase of about 17%, and non-GAAP gross margin projected to remain between 83% and 85%.
This guidance indicates that AI storage demand has not cooled down significantly, but it also reveals the high sensitivity of SanDisk's current financial performance to NAND prices. As most of the growth stems from price increases rather than volume, revenue, gross margin, and EPS could decline simultaneously once the supply-demand gap narrows in the future.
In the short term, memory supply remains tight. Some institutions project that NAND wafer production may fall in 2026 and experience only a mild recovery in 2027, with larger-scale new supply unlikely to enter the market until around 2028. SanDisk has also signed long-term supply agreements with several customers to enhance the stability of its future revenue and profit margins.
However, AI demand cannot fully offset weakness in other markets. SanDisk's fourth-quarter consumer business revenue fell 32% quarter-over-quarter, indicating that demand for personal electronic devices remains under pressure. If enterprise AI capital expenditures are cut, or if the recovery in consumer electronics falls short of expectations, the company's growth rate could decline rapidly.
Can S&P 100 Inclusion Continue to Drive Up SanDisk Stock Price?
SanDisk officially joined the S&P 100 Index on September 21, becoming a new constituent alongside Dell Technologies (DELL), Palo Alto Networks (PANW), and Arista Networks (ANET). Comprising large-cap, highly liquid U.S. blue-chip companies, the S&P 100 Index is an important subset of the S&P 500 Index.
This inclusion helps enhance SanDisk's institutional visibility and generates some demand from passive index funds. However, since SanDisk was already a component of the S&P 500 Index, the vast majority of index funds tracking U.S. large-cap stocks already hold the share. Compared to the massive size of funds tied to the S&P 500, the capital solely tracking the S&P 100 is relatively small, making incremental buying demand unlikely to serve as a primary driver for long-term gains. Therefore, its inclusion in the S&P 100 is more of an affirmation of SanDisk's market capitalization and market position.
SanDisk Stock Technical Analysis: $2,000 Is Key Resistance Level
Source: TradingView
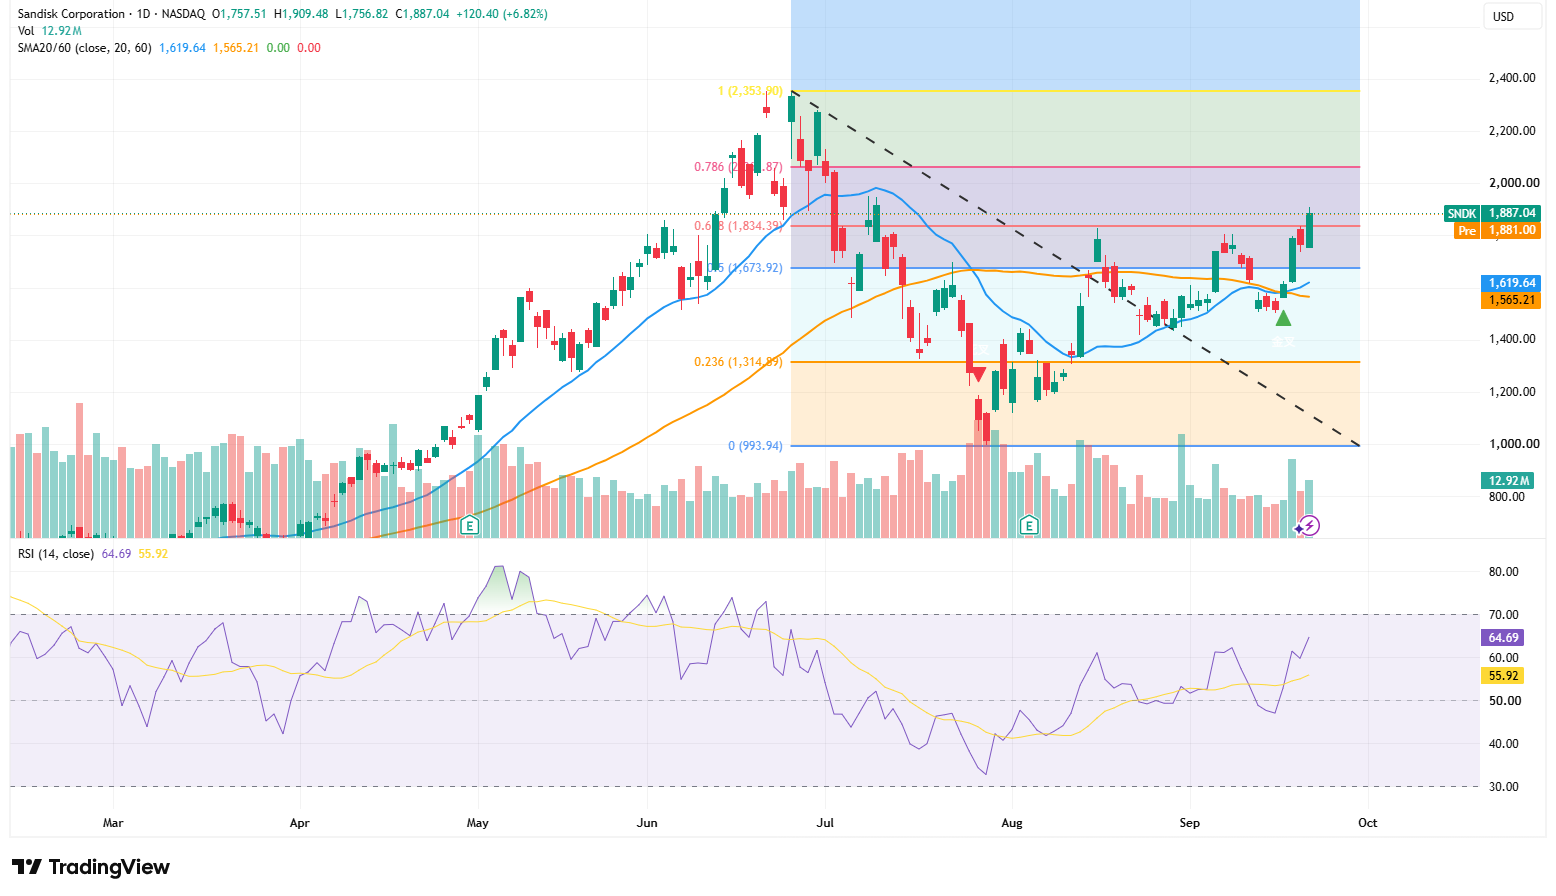
SanDisk's stock price rose 6.82% on the 22nd to close at $1,887.04, reclaiming the 0.618 Fibonacci level of $1,834.39 and breaking above its previous downtrend line. The stock is also trading well above its 20-day moving average of $1,619.64 and 60-day moving average of $1,565.21, signaling strengthening short- to medium-term momentum.
To the upside, attention should first be focused on the resistance zone of $2,000–$2,060, with around $2,060 corresponding to the 0.786 level. If the daily chart closes above this region on heavy volume, the stock could subsequently challenge $2,200 and its previous high of $2,353.90. To the downside, the initial support lies at $1,834; a breakdown below this level could lead to a retest of $1,674, with further support located in the moving average zone of $1,565–$1,620.
The RSI rose to 64.69, above its signal line of 55.92, indicating strengthening bullish momentum while gradually approaching overbought territory. Overall, SanDisk's upward structure remains intact, and $2,000–$2,060 will serve as a key hurdle in determining whether the stock can open up further upside potential.
This content was translated using AI and reviewed for clarity. It is for informational purposes only.
Recommended Articles











Comments (0)
Click the $ button, enter the symbol, and select to link a stock, ETF, or other ticker.