


SK Hynix vs. Micron: Which AI Memory Stock, SKHY or MU, Is Better for Long-Term Holding?



AI Podcast


Driven by surging AI server demand, SK Hynix and Micron are capitalizing on high-bandwidth memory growth, boasting cyclical high operating margins. SK Hynix demonstrates superior HBM mass-production experience and stock price elasticity, though investors must navigate exchange rates and ADR spreads. Micron offers a simpler U.S. common stock structure and advanced volume shipments for Nvidia's platform. Key variables for both companies include HBM4/4E execution, advanced packaging yields, and capital expenditure returns. Sustained performance relies on order execution and maintaining earnings growth amid market peaks.

TradingKey - Rapidly growing demand from AI servers for high-bandwidth memory (HBM) and data center storage has made SK Hynix (SKHY) and Micron (MU) direct beneficiaries.
However, when investors buy SK Hynix and Micron, they compare not only HBM performance, but also mass production progress, earnings quality, capital expenditures, and security structure.
SK Hynix has already mass-produced HBM3, HBM3E, and HBM4, while Micron is simultaneously advancing HBM4, SOCAMM2, and data center SSDs. The main differences between the two lie in their HBM market position, customer structure, capacity allocation, and valuation levels.
What Is the Difference Between SK Hynix and Micron?
Comparison Item | SK Hynix (SKHY) | Micron Technology (MU) |
Core Products | HBM, DRAM, NAND, enterprise SSDs | HBM, DRAM, NAND, data center SSDs |
Latest Progress | HBM4 is shipping in volume; HBM4E has been sampled to major customers | HBM4, SOCAMM2, and PCIe 6.0 SSDs have entered volume production |
Security Structure | Every 10 ADSs represent 1 South Korean common share | Nasdaq common stock |
Key Risks | ADR price spread, KRW exchange rate, and memory cycles | Valuation, capital expenditures, memory cycles, and Chinese market restrictions |
SKHY was listed on Nasdaq in July 2026, with the underlying asset remaining SK Hynix South Korean common stock. USD trading improves investment convenience, but investors still need to consider the South Korean won exchange rate, South Korean regulations, and the ADR price spread relative to South Korean common stock. MU, on the other hand, is common stock of a U.S. company with a relatively simple security structure.
HBM4 Technology and Profitability Comparison
SK Hynix began volume shipments in the second quarter of HBM4 utilizing 1b DRAM and Advanced MR-MUF packaging. Samples of its 48GB, 12-layer HBM4E have been provided to major customers, featuring a single-pin speed of up to 16 Gbps and an energy efficiency improvement of over 20% compared with HBM4, and it is currently in the customer validation stage.
Micron's 36GB, 12-layer HBM4 utilizing 1β DRAM has begun volume shipments for Nvidia's Vera Rubin platform, with bandwidth exceeding 2.8 TB/s. HBM4E utilizing 1γ DRAM is expected to enter mass production in 2027, while SOCAMM2 and PCIe 6.0 data center SSDs have also entered mass production.
SK Hynix reported second-quarter 2026 revenue of 79.32 trillion Korean won with a K-IFRS operating margin of 76%; Micron reported third-quarter fiscal 2026 revenue of $41.456 billion, a US GAAP operating margin of 80.4%, and operating cash flow of $25.388 billion.
Both companies have benefited from rising memory prices and growing shipments of high-value-added products, with current profit margins sitting at cyclical highs.
SKHY vs. MU: Which Is Better for Long-Term Holding?
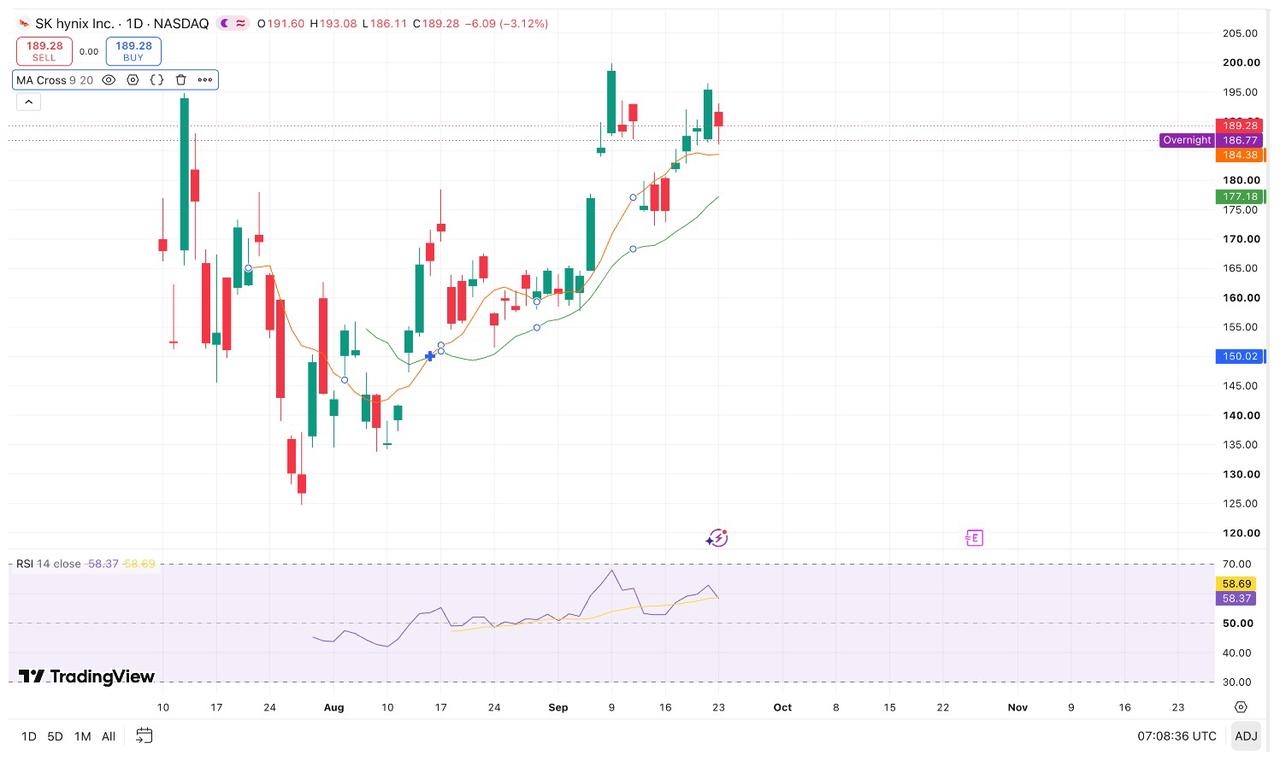
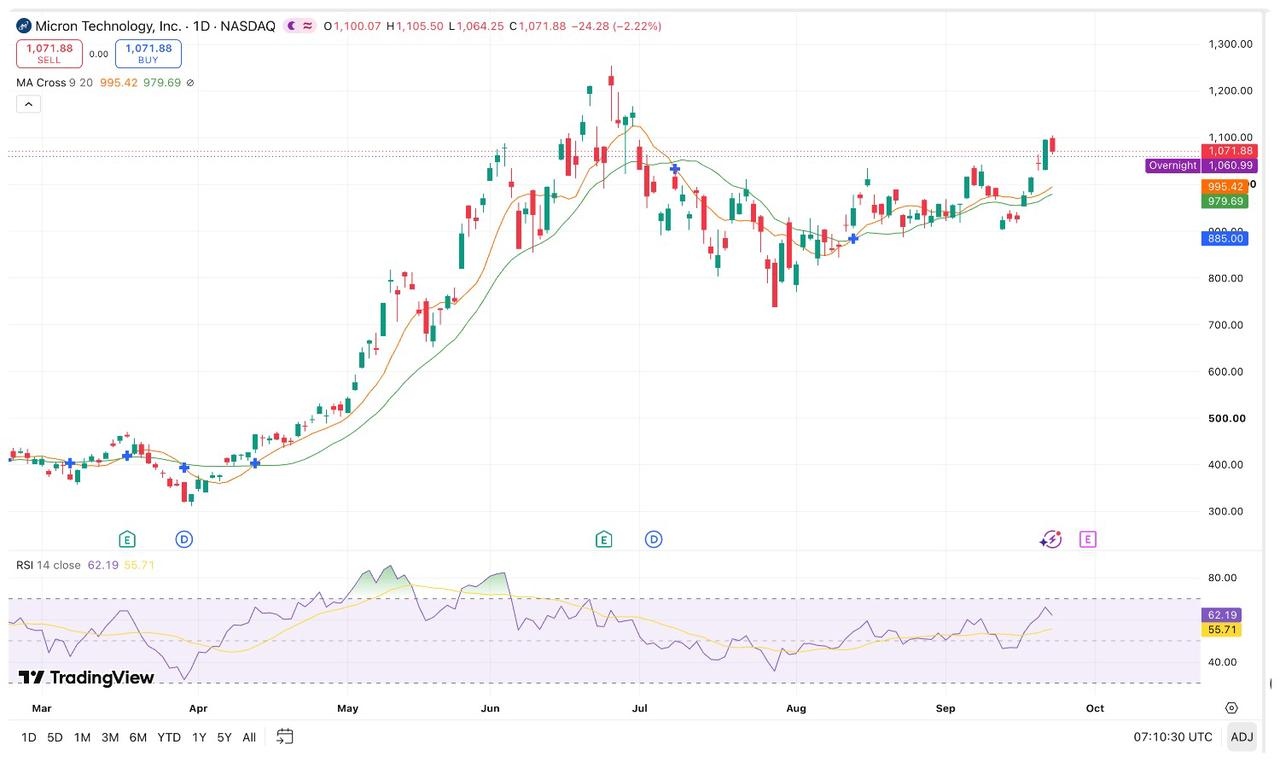
As of September 23, 2026, SKHY and MU closed at $189.28 and $1,071.88, respectively.
SKHY's 20-day simple moving average is approximately $177.18. The $185–$186 range serves as the immediate primary support level; if breached, the next support to monitor is around $177–$178. To the upside, $199.87–$200 forms a major resistance zone, and a breakout could bring the previous high region into focus.
[Source: TradingView]
MU's 20-day simple moving average is approximately $979.69. The $1,040–$1,065 range is the near-term support zone, with $1,042.40 marking a previous breakout level and around $1,064 corresponding to the intraday low on September 23.
To the upside, $1,097–$1,105 represents a near-term resistance zone; if it establishes a firm footing on heavy volume, the next upside target could be the all-time high of $1,255 set in June.
[Source: TradingView]
Over the long term, SKHY is better suited for investors who value HBM mass-production experience and can tolerate depositary receipt price spreads and South Korean won exchange rate fluctuations. MU features a Nasdaq common stock structure, where USD trading and SEC financial disclosures make it easier for US investors to track.
SK Hynix boasts richer experience in HBM mass production, but its HBM4E remains in the sample delivery and customer validation stage; Micron Technology, on the other hand, has begun volume shipments of HBM4 for Nvidia's Vera Rubin platform. In comparison, SKHY may offer higher stock price elasticity, while MU provides a more direct security structure and trading basis.
Key variables over the next three years include HBM4 volume expansion, HBM4E mass production progress, advanced packaging yield, customer concentration, and return on capital expenditures. Following substantial rallies in both stocks, subsequent performance will mainly depend on order execution and whether earnings growth can be sustained.
This content was translated using AI and reviewed for clarity. It is for informational purposes only.
Recommended Articles











Comments (0)
Click the $ button, enter the symbol, and select to link a stock, ETF, or other ticker.