


Apple Stock Price Forecast: Where Is the Next Target Price After Record High as iPhone 18 Pro Series Demand Heats Up?



AI Podcast


Apple stock hit an all-time high on September 22 Eastern Time, driven by optimism over the iPhone 18 Pro series. JPMorgan reports global average delivery wait times for the Pro and Pro Max models extended significantly in the second week, surpassing initial sluggish trends and signaling robust demand across major markets. While technical indicators show a strong upward structure testing previous highs near $344.57, sustainability remains contingent on upcoming pre-orders for the foldable iPhone Duo and subsequent supply chain adjustments. Key downside support rests at the 5-day moving average of $338.05, with pullback risks if demand proves fleeting.

TradingKey - Apple (AAPL) stock hit an all-time high on September 22 Eastern Time, just 10 days after Apple's autumn launch event.
However, as to how much higher this rally can go, the answer lies not in the launch event, but in the actual demand for the iPhone 18 Pro series. JPMorgan's latest research report provided the first positive signal: the global average delivery wait time for the iPhone 18 Pro extended from 7 days in the first week to 23 days in the second week, with order momentum already surpassing that of the iPhone 17 series during the same period last year.
iPhone Demand Expectations Are the Main Support for Stock Price Rise
The iPhone has long generated half of Apple's revenue, with the Pro series serving as the engine for high-end profits. Financial report data show that Apple's iPhone revenue reached $54.25 billion in the third quarter of fiscal 2026, accounting for roughly 49.6% of its total single-quarter revenue ($109.4 billion).
Only if the new phones sell well will the fourth-quarter earnings report and subsequent performance guidance be supported; if they fail to sell, the stock price—having hit new highs—faces pullback pressure at any time.
The fastest signal investors can obtain is not the financial report, but delivery wait times: the estimated number of days consumers must wait to receive their orders after placing them. Assuming supply conditions remain unchanged, longer wait times indicate faster order growth and a tightening supply-demand balance.
iPhone 18 Pro Series Demand Picks Up From First Week
JPMorgan stated that after entering the second week of pre-orders, delivery wait times for Apple's iPhone 18 Pro series lengthened significantly, currently approaching overall levels seen during the same period for last year's iPhone 17 series, indicating that recent demand for the Pro series has picked up compared with the first week. Notably, the bank's preliminary tracking last week showed that initial delivery cycles for the iPhone 18 series were shorter than during the same period last year, suggesting that some consumers were holding off on placing orders while waiting for the Duo.
The latest data shows that the global average delivery wait time for the iPhone 18 Pro increased sharply from 7 days in the first week to 23 days in the second week, while that for the iPhone 18 Pro Max lengthened from 19 days to 30 days. Wait times in key markets such as Germany, the UK, and the US are currently roughly in line with the same period for last year's iPhone 17 series.
By region, wait times for the iPhone 18 Pro and Pro Max in the US market rose to 21 days and 28 days, respectively, up from just 2 days and 22 days in the previous week. In the German market, wait times for the two models increased from 5 days and 16 days to 22 days and 29 days, respectively.
Wait times in Asian markets also lengthened noticeably. In China, wait times for the iPhone 18 Pro and Pro Max currently stand at 27 days and 33 days, respectively, a significant increase from 13 days and 21 days in the previous week. However, this level remains below the 30 days and 37 days seen during the same period for last year's iPhone 17 series. JPMorgan also noted that the iPhone 18 Pro Max is currently unavailable for in-store pickup in China, which may also have had some impact on the wait time data.
More importantly, any assessment of demand cannot bypass Apple's first foldable phone, the iPhone Duo. Global pre-orders for the device will not begin until October 16; prior to this, consumers waiting for the Duo depressed first-week orders, and data over the coming weeks may continue to be diluted.
The extent of the pullback in wait times during the third week will therefore be critical: remaining high would indicate sustainable demand, while a rapid drop would suggest that the second-week surge was driven more by orders concentrated ahead of the Duo pre-orders. A more decisive signal will emerge around November, as the market typically obtains truly reliable demand verification only when the supply chain begins adjusting production plans.
Apple Technical Analysis
After touching $345.34 on September 22, Apple's stock price pulled back below its previous high of $344.57. The stock is currently in a second upward attempt below the previous high of $344.57. The price has reclaimed the 0.786 Fibonacci retracement level ($335.00) and short-, medium-, and long-term moving averages, showing an overall strong structure.
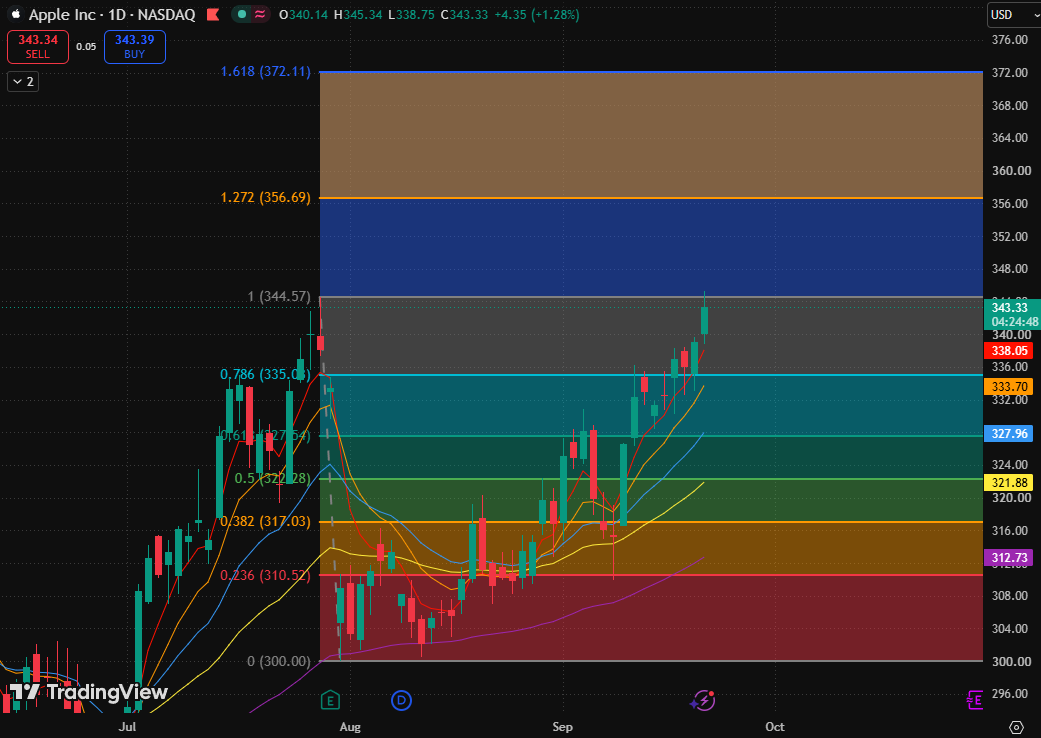
Apple daily chart, Source: TradingView
Looking at Apple's stock chart, although it briefly crossed $344.57 intraday, a breakout has not yet been confirmed; therefore, this remains a test of the previous high rather than a confirmed breakout to a new high.
If the stock price holds firmly above $344.57, the next targets will be the 1.272 Fibonacci extension level ($356.69) and the 1.618 Fibonacci extension level ($372.11).
For downside support, the first level is the 5-day moving average ($338.05), which serves as the nearest dynamic support during the attempt to break the previous high; if held, short-term strength remains intact. If it falls below this level, it will seek support in the zone formed by the 0.786 Fibonacci retracement level ($335.00) and the 10-day moving average ($333.70). Notably, a pullback to this zone would still represent a normal consolidation within an uptrend.
This content was translated using AI and reviewed for clarity. It is for informational purposes only.
Recommended Articles












Comments (0)
Click the $ button, enter the symbol, and select to link a stock, ETF, or other ticker.