


Google Stock Price Forecast: Bucks Trend With Three-Day Rally, Shares Poised to Challenge $380 Again



AI Podcast


As of the close on September 14 Eastern Time, Alphabet (GOOGL) gained 3.06% to close at $345.71 amid a broader market decline, driven by industry calls to slow frontier AI development, which may ease its capital expenditure pressures. Technically, the stock has reclaimed major short-term moving averages with positive MACD momentum. However, the 14-day RSI at 73.6 indicates overbought conditions and rising pullback risks. Resistance stands near $350, with a breakout potentially targeting $381.81, while downside support is positioned at $325.

TradingKey - As of the close on September 14 Eastern Time, against the backdrop of a 0.48% drop in the S&P 500 Index and a 0.56% decline in the Nasdaq, Google's parent company Alphabet (GOOGL) bucked the trend to gain 3.06%, closing at $345.71 after touching an intraday high of $349.89, marking its third consecutive trading day of gains and showing a clear strengthening in its recent trend; trading volume rose to approximately 35.9 million shares, noticeably higher than recent levels.
Analysts believe that calls from executives at OpenAI, Anthropic, and xAI to slow down frontier AI development may ease Google's massive AI capital expenditure and competitive pressures in the short term, serving as a key catalyst for the stock's strength that day.
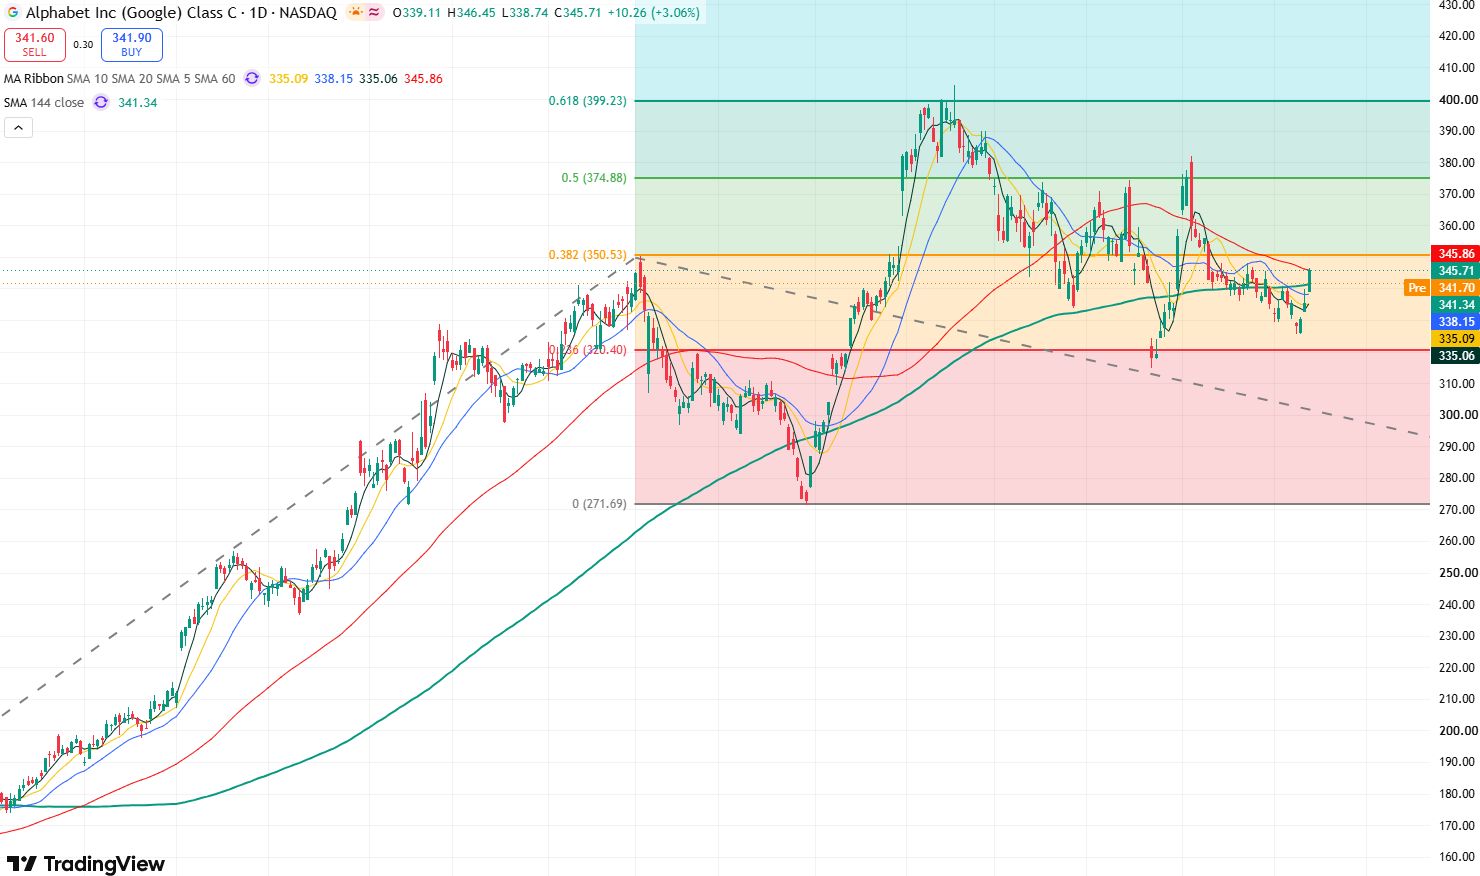
GOOGL daily price chart, Source: TradingView
Looking at the daily price chart of GOOGL, the stock has rebounded continuously after falling to $325.63 on September 9, and has now reclaimed its major short-term moving averages. The latest 5-day, 10-day, and 20-day moving averages stand at approximately $335.06, $335.09, and $338.15, respectively, while the 144-day moving average is at $341.24. The current stock price is above these moving averages, showing a clear improvement in the short-term trend.
Regarding technical indicators, the 14-day RSI has risen to 73.6, entering overbought territory, which suggests the risk of a short-term pullback may be gradually increasing; the MACD remains positive and maintains a buy signal. Although the risk of a near-term pullback might be growing, market momentum clearly favors the bulls, leaving room for further gains in the short term.
Currently, the stock price has risen to just below the 60-day moving average and remains under the short-term resistance level of $350. If the stock can effectively break out and hold above $350 in the short term, it is expected to challenge its recent rebound high of $381.81 again.
On the downside, the primary support level to watch below is near $325; if this level fails to hold, the stock may suffer a deeper pullback toward the July low near $314.89.
This content was translated using AI and reviewed for clarity. It is for informational purposes only.
Recommended Articles












Comments (0)
Click the $ button, enter the symbol, and select to link a stock, ETF, or other ticker.